
Strauss Group concluded the first half of 2014 with approximately 3.3% organic growth (excluding the foreign currency effect)
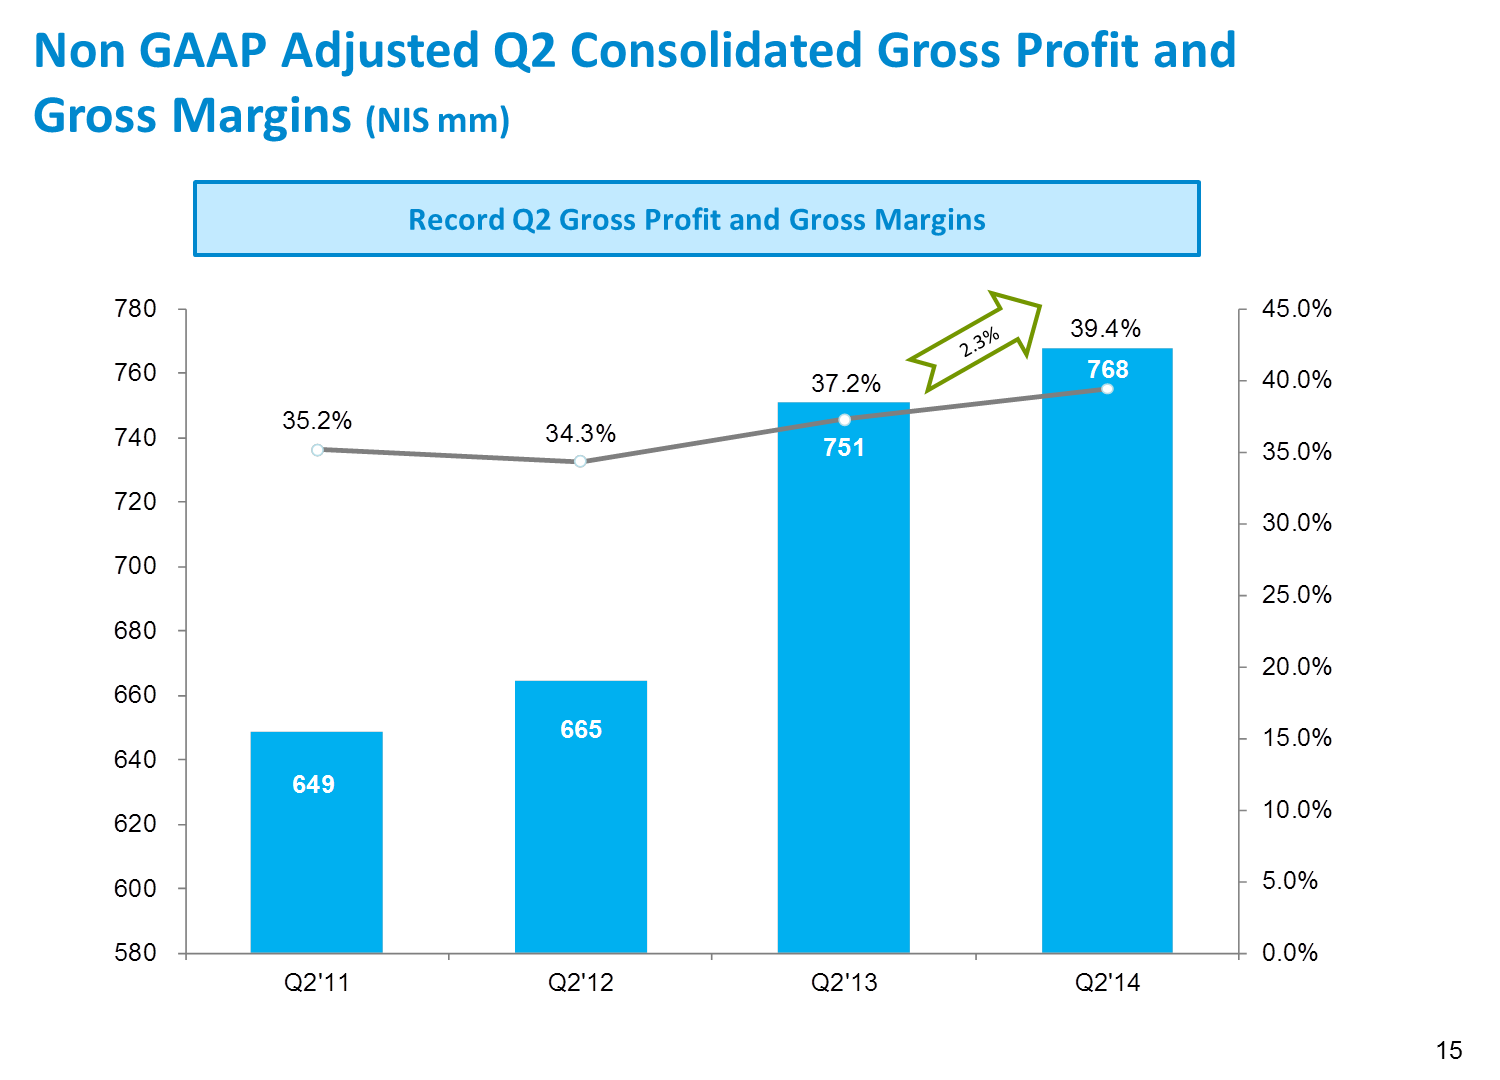
Thanks to an improvement in the results of our international growth drivers, in the second quarter the gross profit grew by 2.3%, and the currency effect on sales was estimated at approximately NIS 95 million
Taking a multi-year perspective, the Group’s Profitability for the half and quarter have continued its trend of improvement
Gadi Lesin, President and Chief Executive Officer of Strauss Group, said today (August 19, 2014): “Strauss posted stable growth excluding the FX effect. The Group is contending with economic challenges in Eastern European markets, notably Russian and Ukraine, while posting continued growth in the international dips and spreads operation and in Strauss Water.”
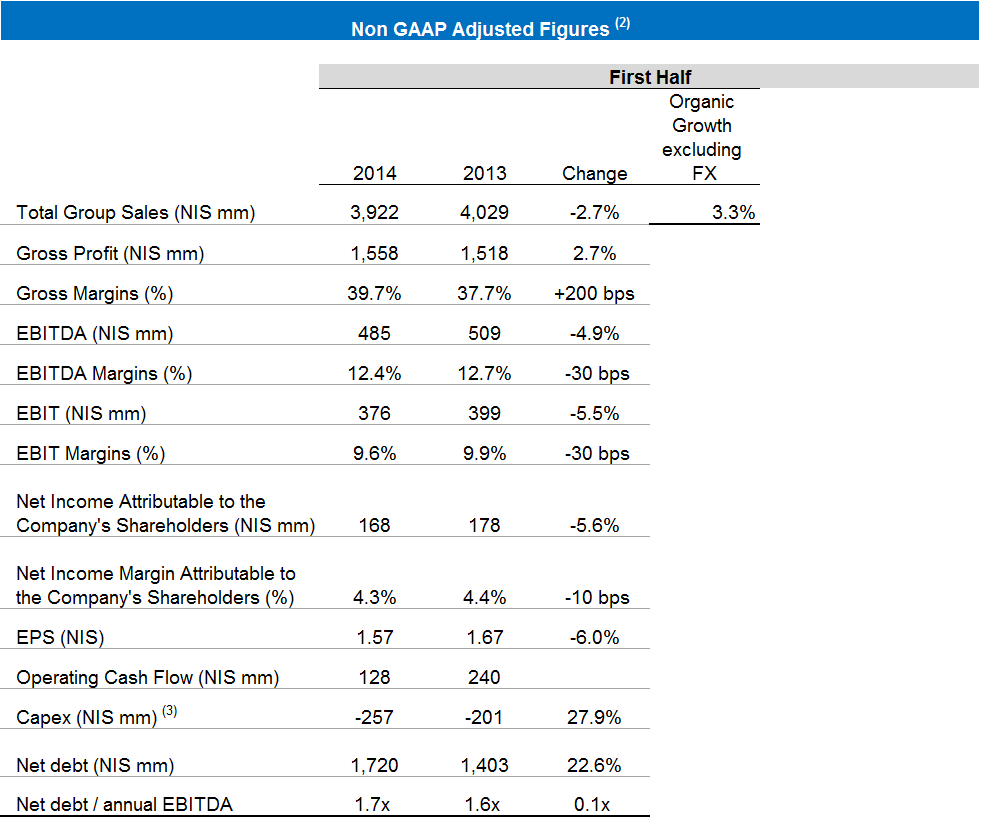
H1 2014 highlights (1)
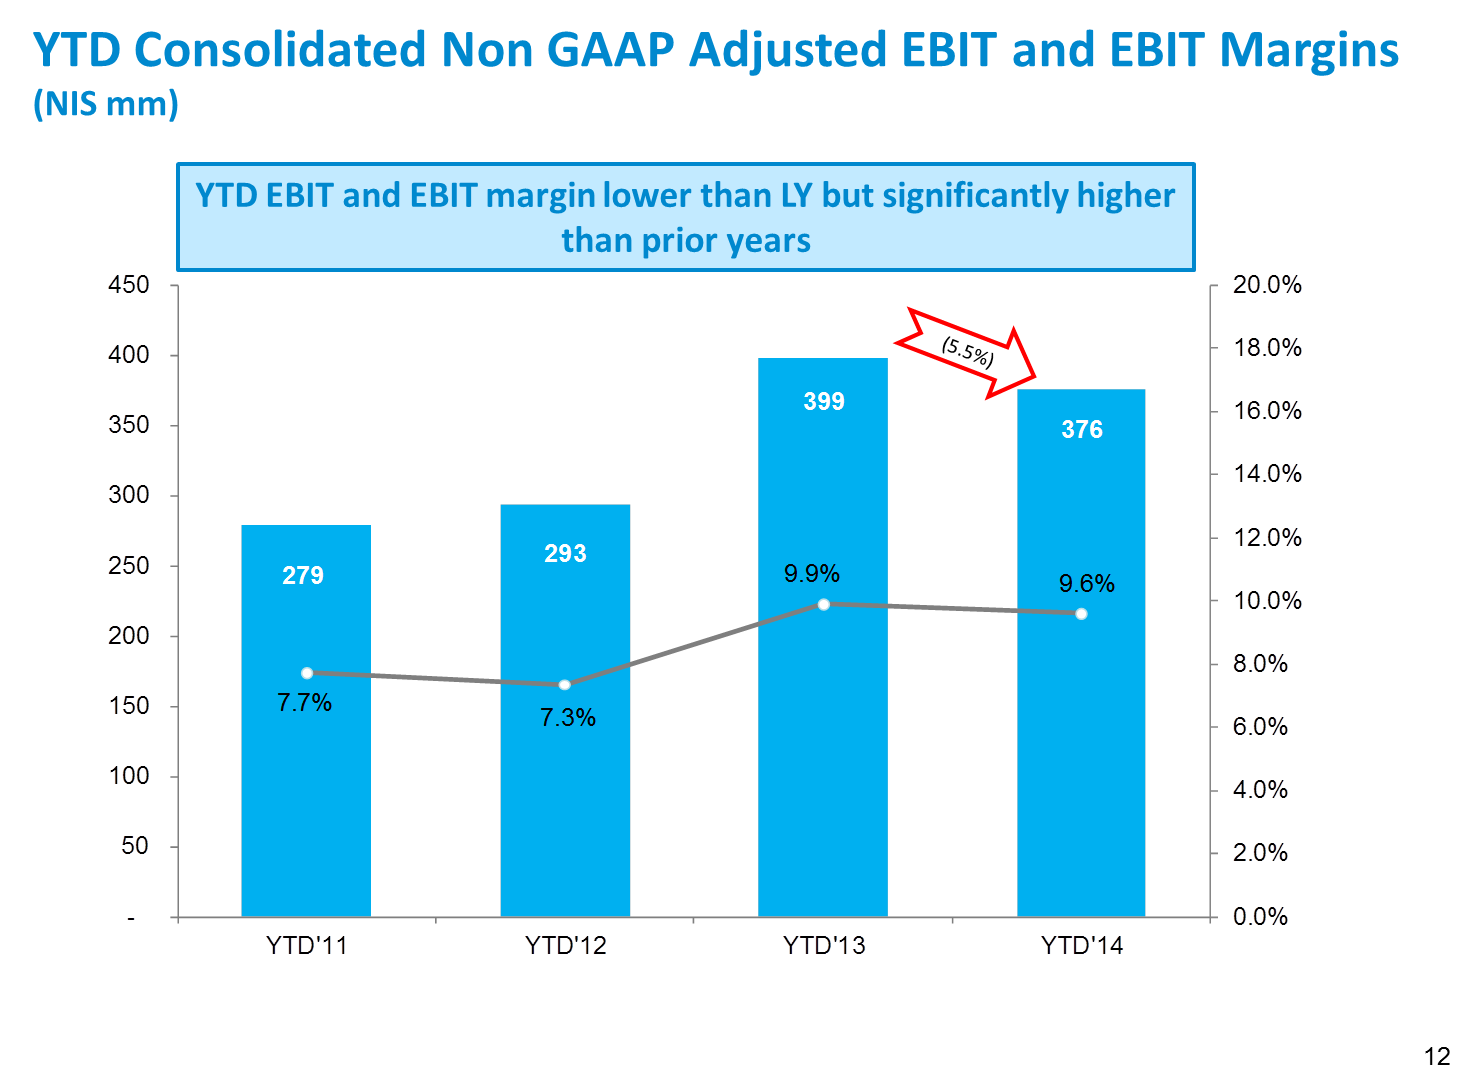
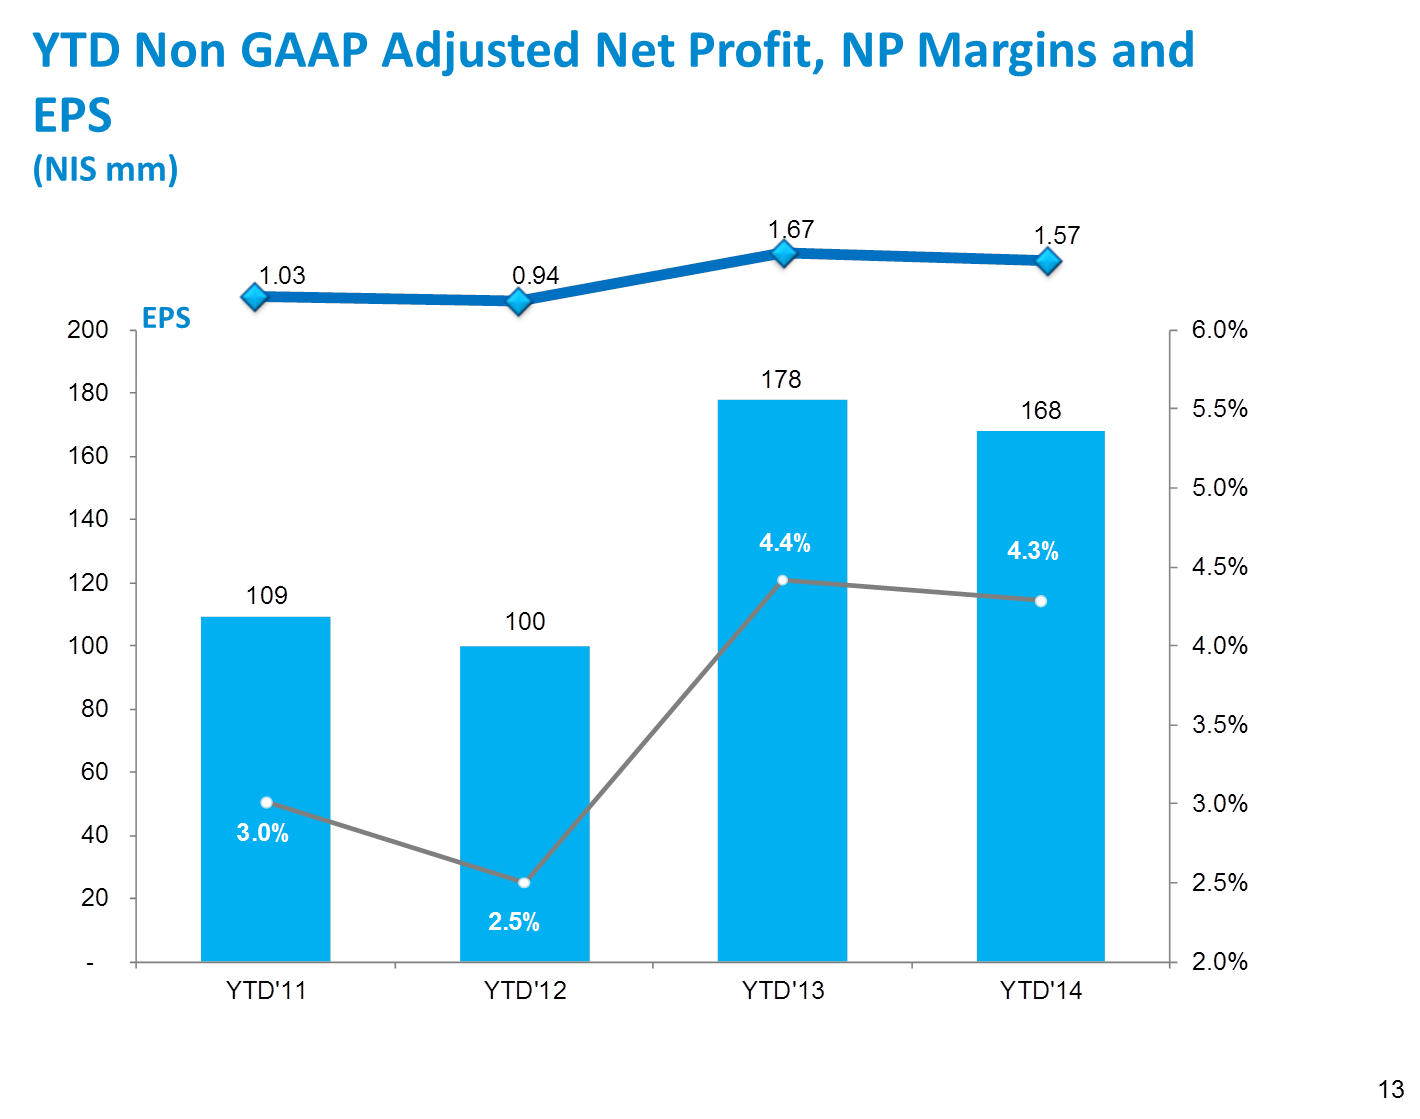
- Although lower than 2013, which was a record year, taking a multi-year perspective the Company’s business results have continued their growth trend.
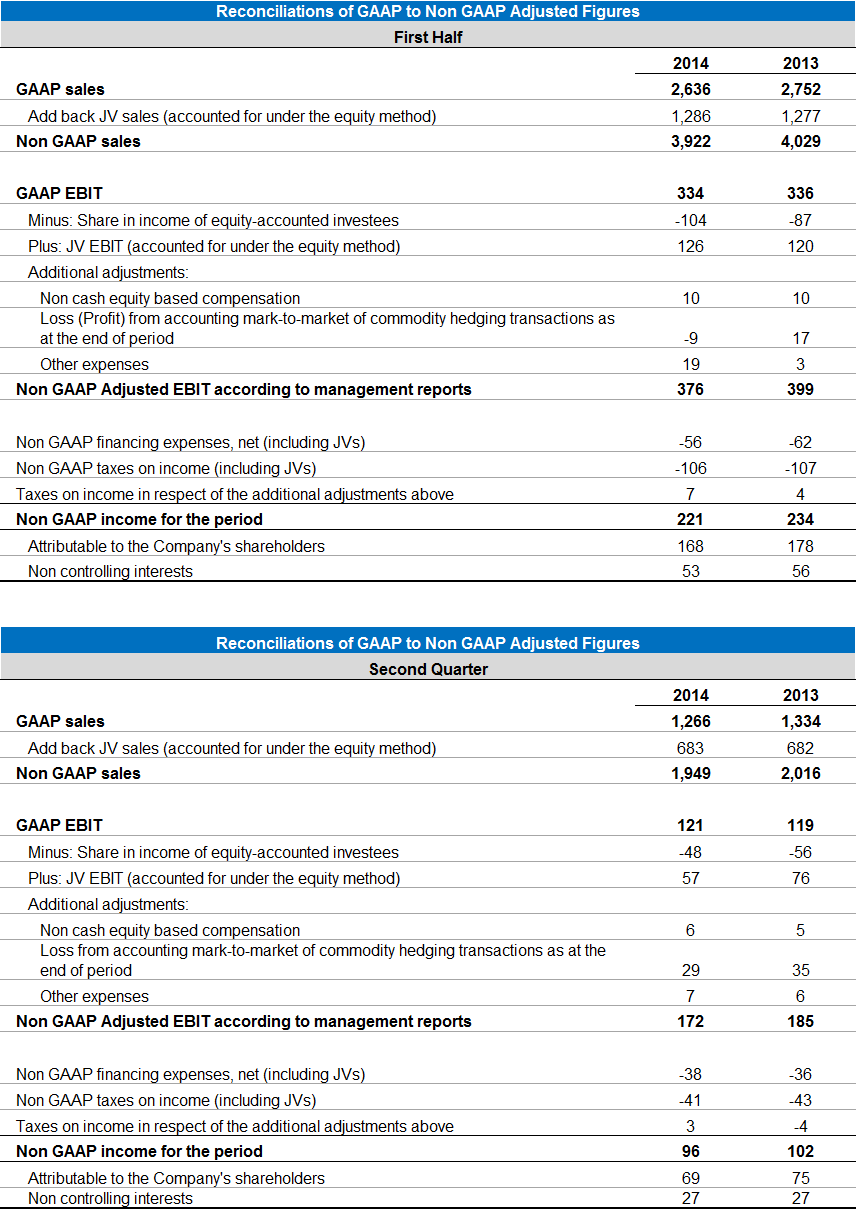
- Organic sales growth, excluding the impact of foreign exchange, was 3.3%. Sales amounted to NIS 3.9 billion, a decrease of 2.7%, reflecting by NIS 228 million negative translation differences as a result of the continued strengthening of the NIS versus other functional currencies of the Group.
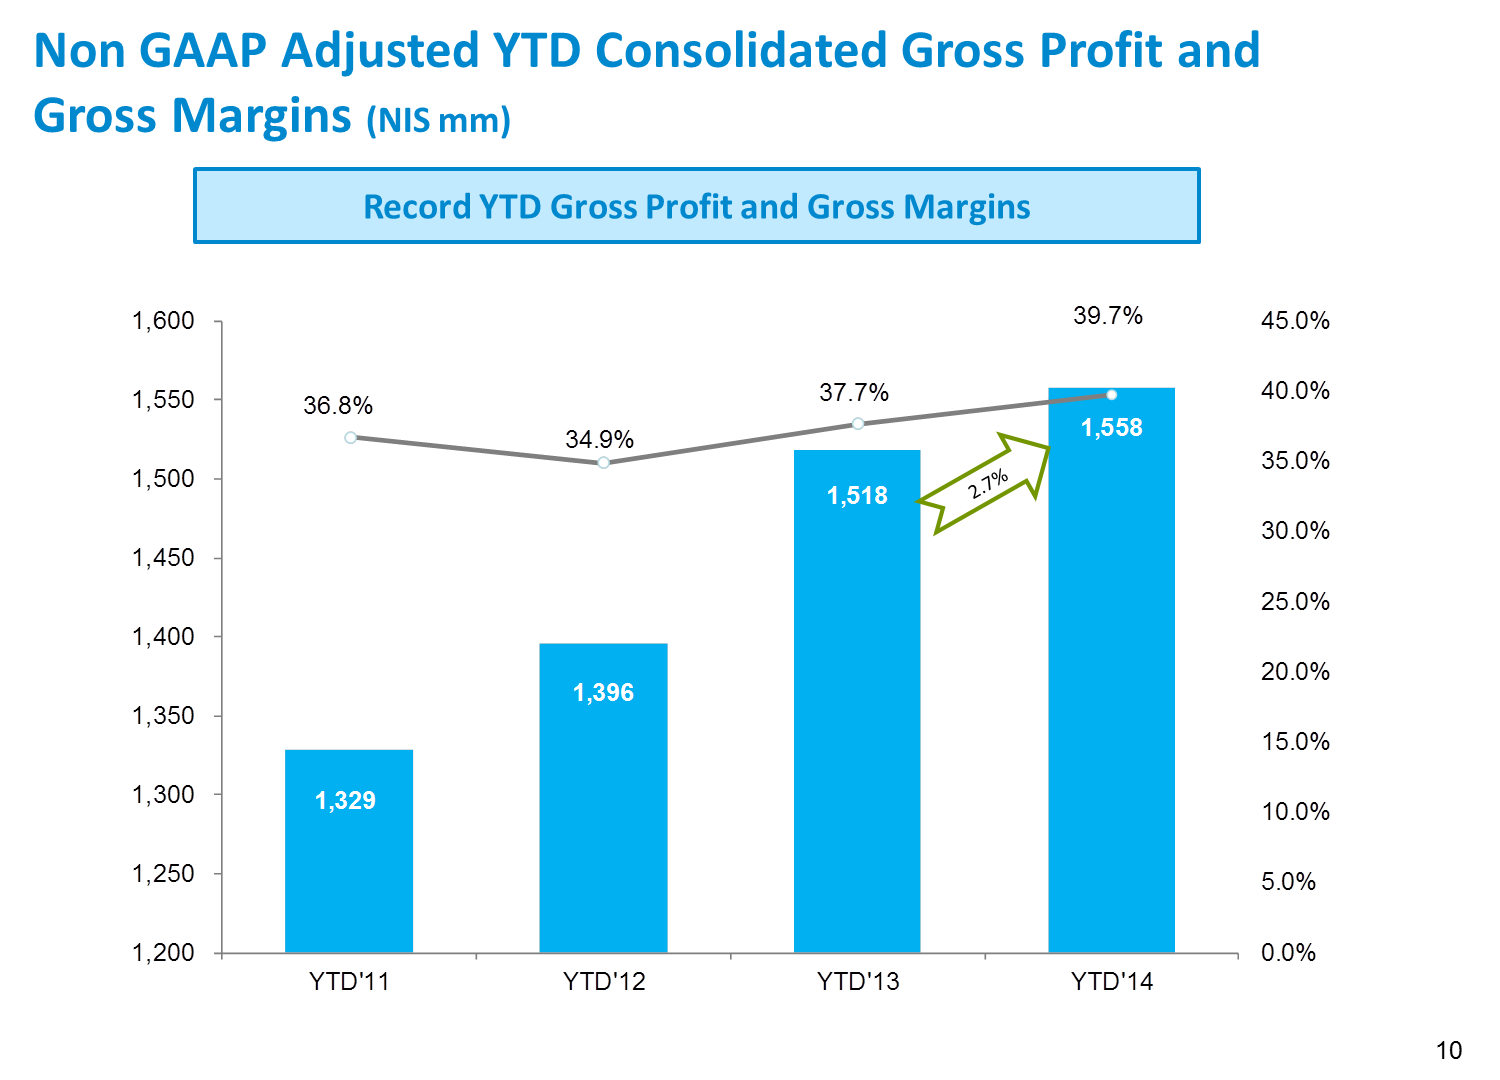
- Gross profit amounted to NIS 1,558 million (39.7% of sales), an increase of 2.7% compared to the corresponding period last year. Gross margins were up 2.0%.
- Operating profit (EBIT) amounted to NIS 376 million (9.6% of sales), a decrease of 5.5% compared to the corresponding period last year. EBIT margins were down 0.3%.
- Earnings per share amounted to NIS 1.57, a decrease of 6.0% compared to the corresponding period last year.
- Cash flows from operating activities amounted to NIS 128 million, compared to NIS 240 million in the corresponding period.
Net debt as at June 30, 2014 amounted to NIS 1,720 million, compared to NIS 1,403 million on June 30, 2013 and NIS 1,475 million on December 31, 2013.
(1) Based on non-GAAP data, which include the proportionate consolidation of jointly-held partnerships (without implementation of IFRS 11) and do not include share-based payment, valuation of the balance of commodity hedging transactions as at end-of-period and other income and expenses, unless stated otherwise.
- Net debt as at June 30, 2014 amounted to NIS 1,720 million, compared to NIS 1,403 million on June 30, 2013 and NIS 1,475 million on December 31, 2013.
(2) Based on non-GAAP data, which include the proportionate consolidation of jointly-held partnerships (without implementation of IFRS 11) and do not include share-based payment, valuation of the balance of commodity hedging transactions as at end-of-period and other income and expenses, unless stated otherwise.
(3) Investments include the acquisition of fixed assets and investment in intangibles and deferred expenses.
Note: Financial data were rounded off to NIS millions. Percentages changes were calculated on the basis of the exact figures in NIS thousands.
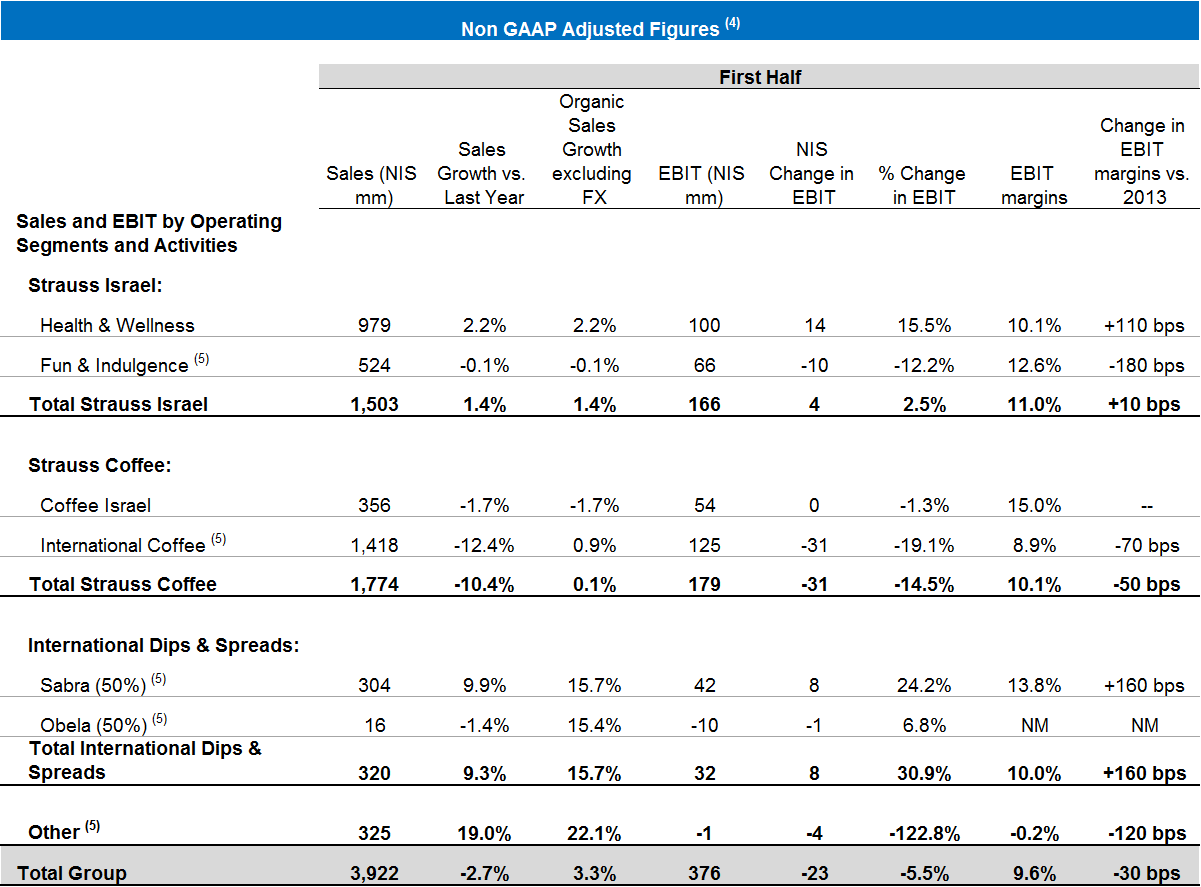
(4) Based on non-GAAP data, which include the proportionate consolidation of jointly-held partnerships (without implementation of IFRS 11) and do not include share-based payment, valuation of the balance of commodity hedging transactions as at end-of-period and other income and expenses, unless stated otherwise.
(5) Fun & Indulgence figures include Strauss 50% share in the salty snacks business. International Coffee figures include Strauss 50% share in Três Corações (3C) – a company jointly held by the Group (50%) and by a local São Miguel Group (50%). International D&S figures reflect Strauss 50% share in Sabra and Obela. Other includes Strauss share in Strauss Water China.
Note: Financial data were rounded off to NIS millions. Percentages changes were calculated on the basis of the exact figures in NIS thousands.
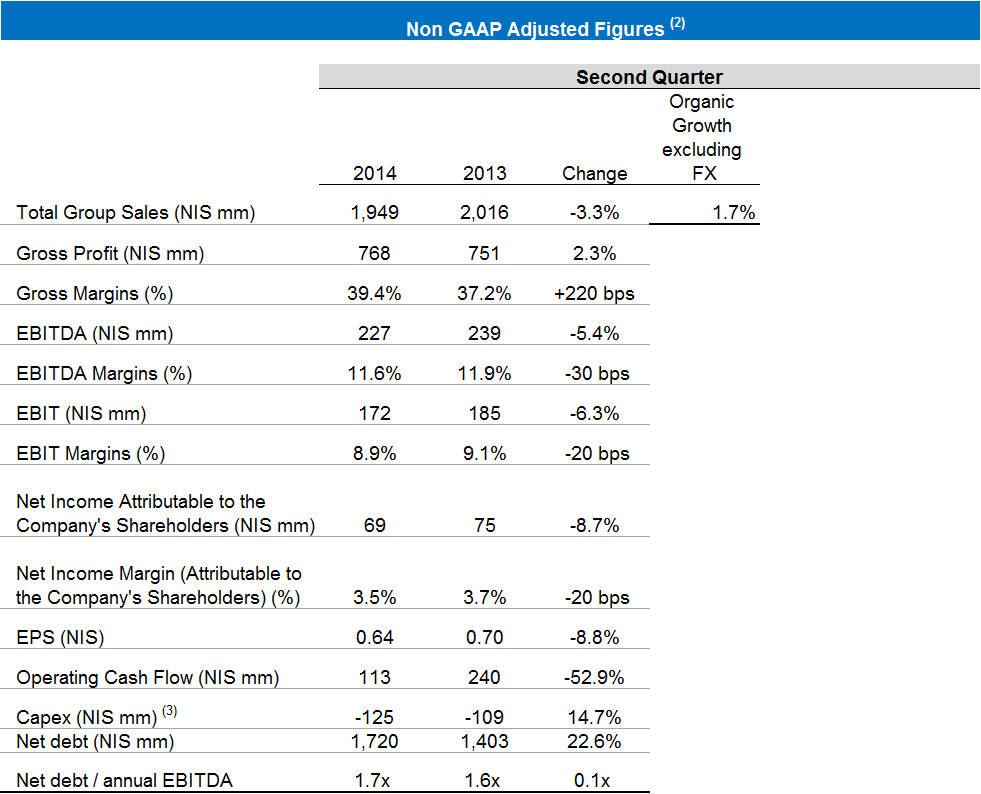
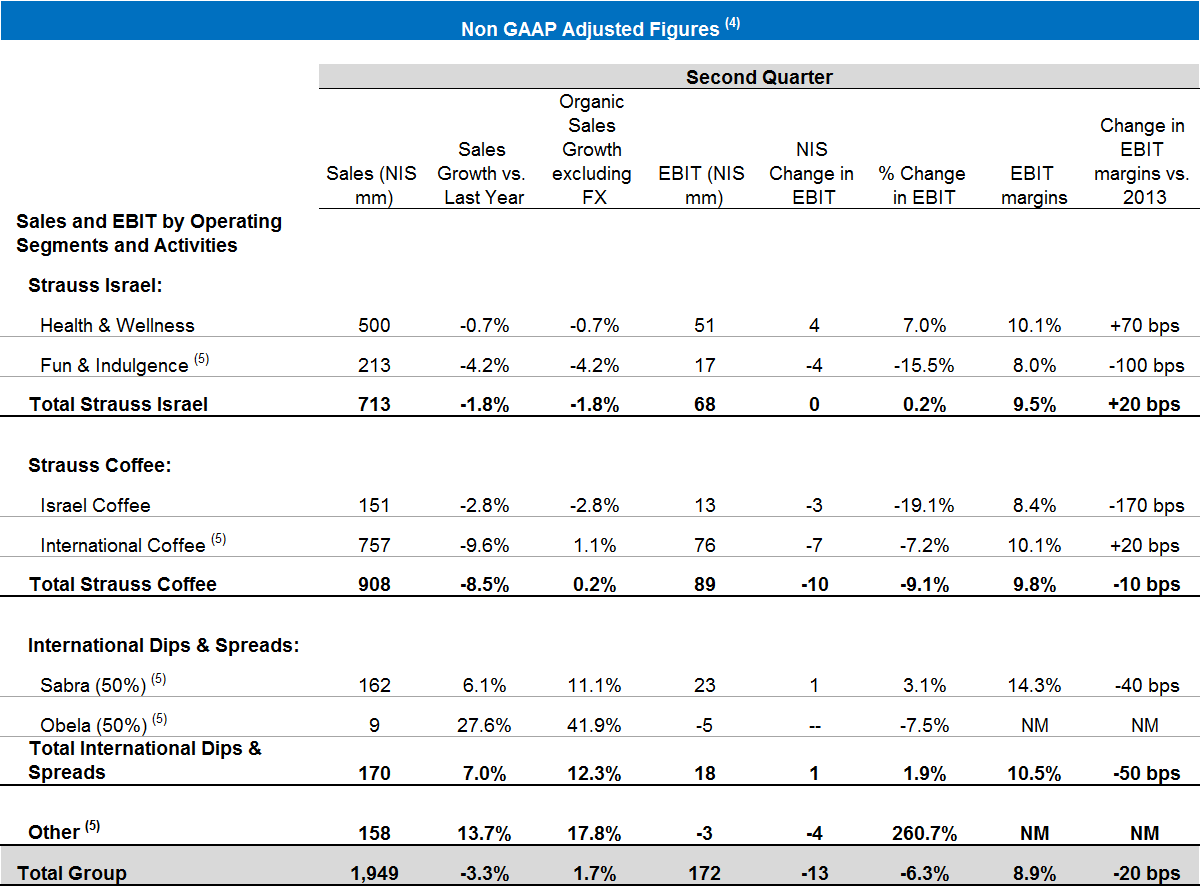
Q2 2014 highlights (1)
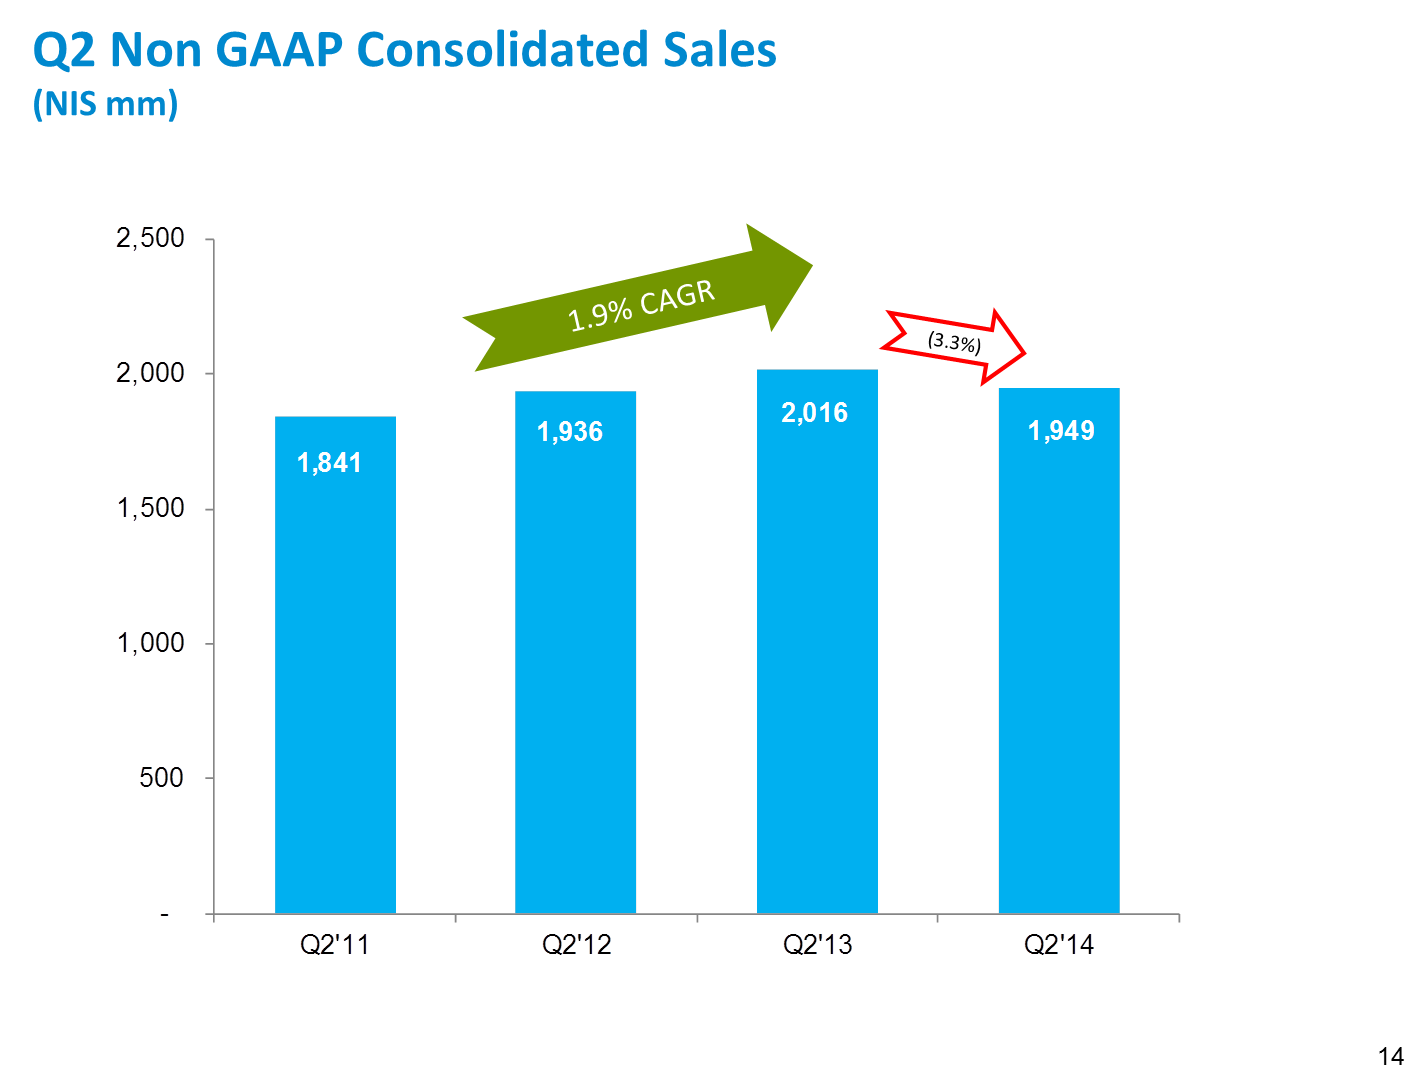
- Although lower than 2013, which was a record year, taking a multi-year perspective the Company’s business results have continued their growth trend.
- Organic sales growth, excluding the impact of foreign exchange, was 1.7%. Sales amounted to NIS 1.9 billion, a decrease of 3.3%, reflecting by NIS 95 million negative translation differences as a result of the continued strengthening of the NIS versus other functional currencies of the Group.
- Gross profit amounted to NIS 768 million (39.4% of sales), an increase of 2.3% compared to the corresponding period last year. Gross margins were up 2.2%.
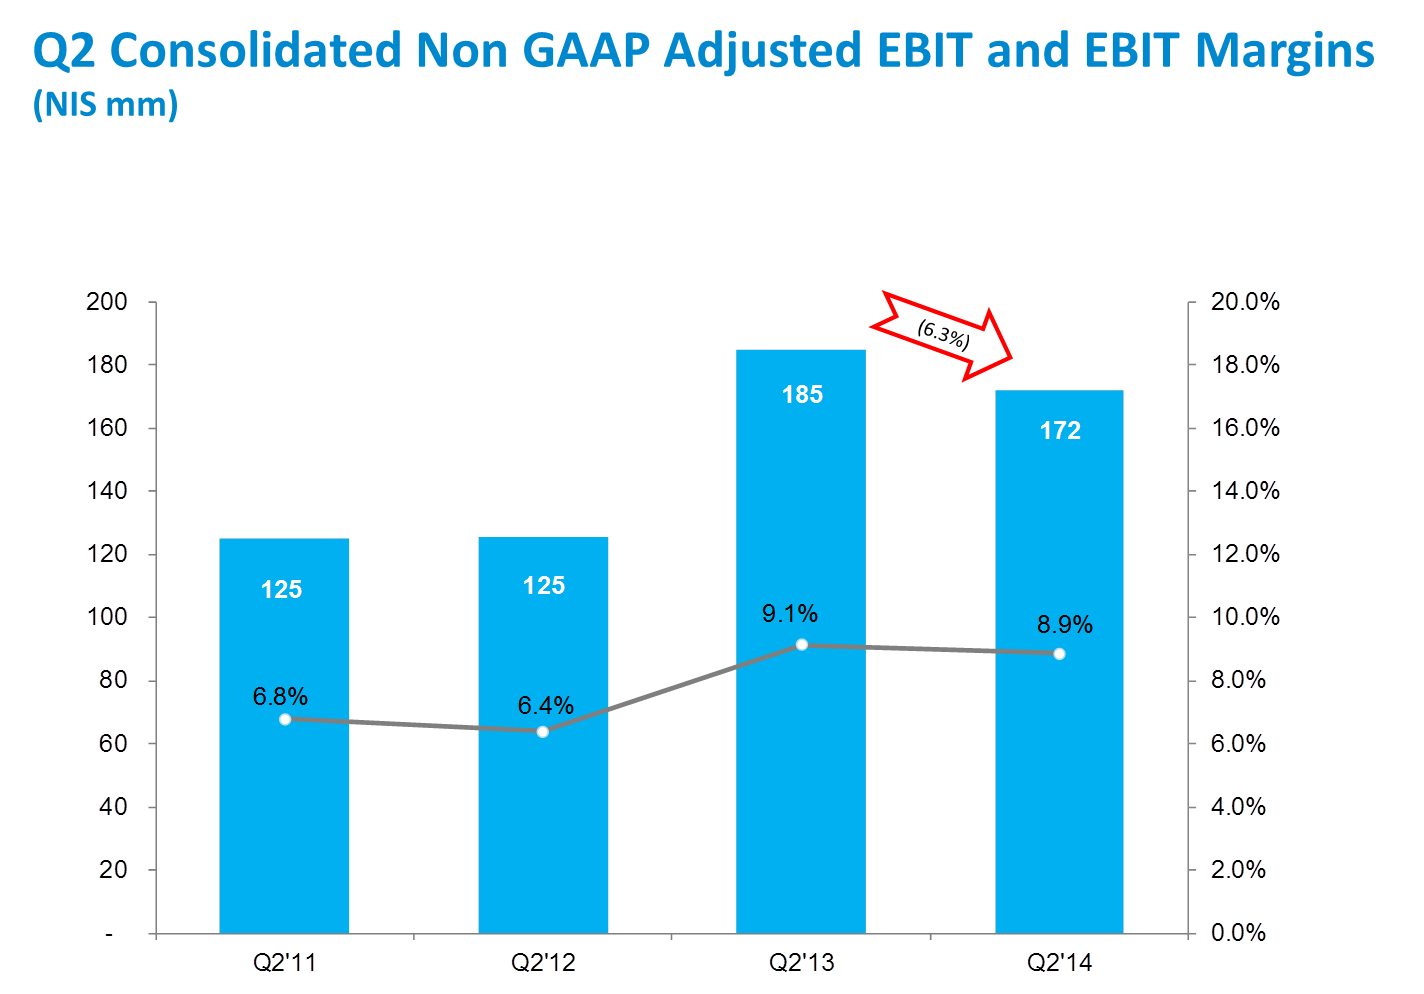
- Operating profit (EBIT) amounted to NIS 172 million (8.9% of sales), a decrease of 6.3% compared to the corresponding period last year. EBIT margins were down 0.2%.
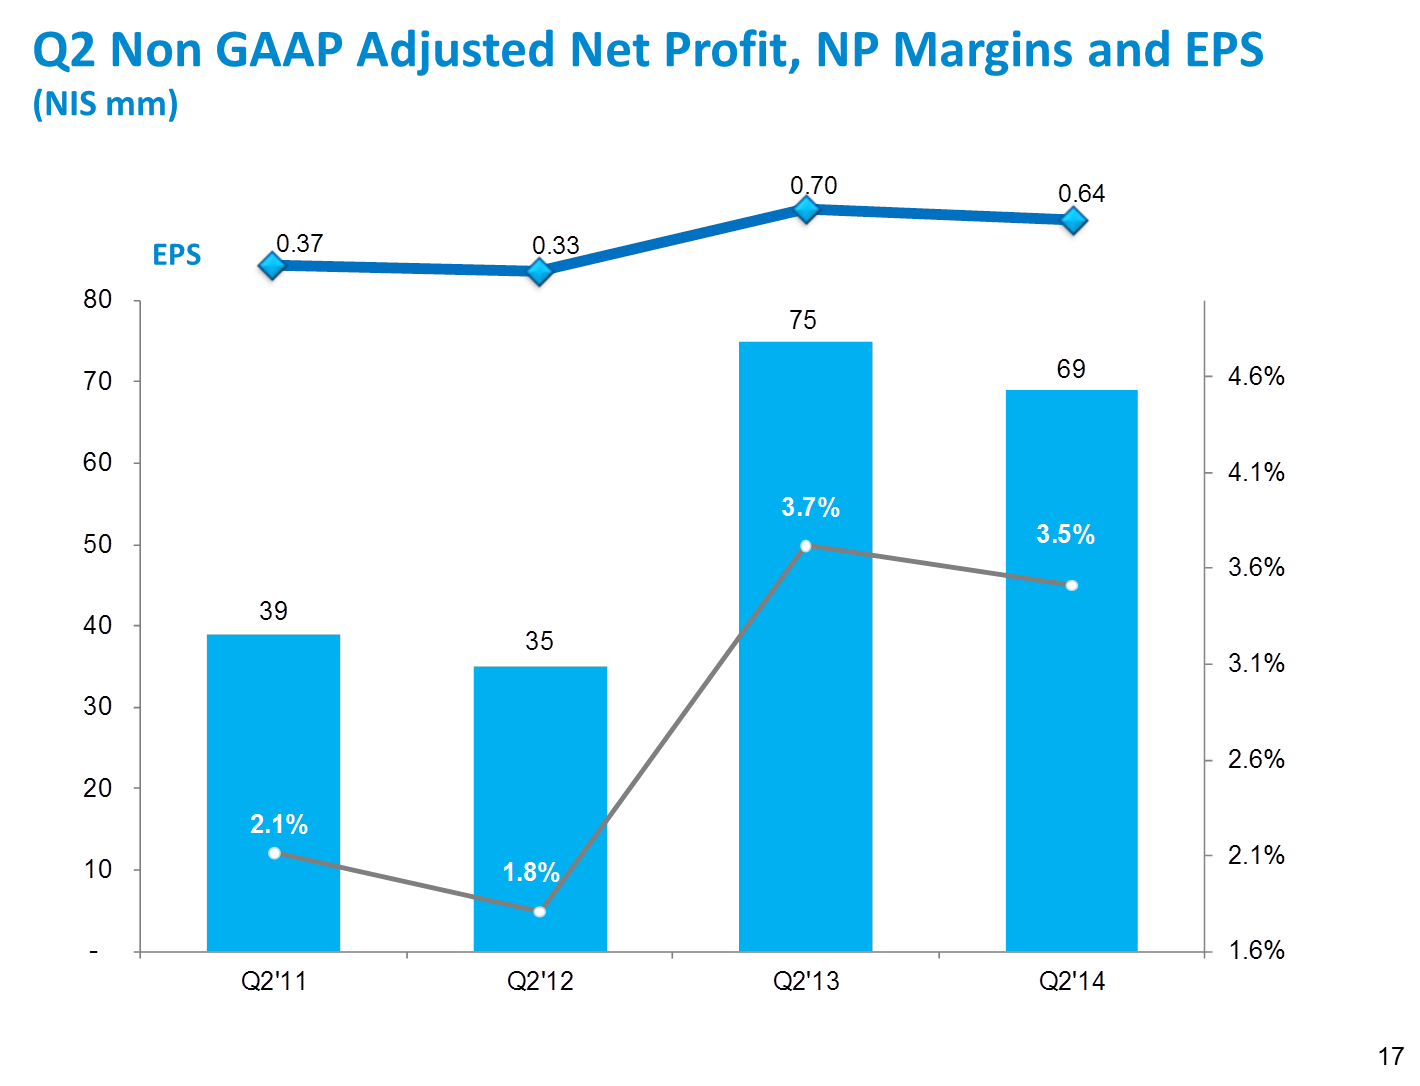
- Earnings per share amounted to NIS 0.64, a decrease of 8.8% compared to the corresponding period last year.
- Cash flows from operating activities amounted to NIS 113 million, compared to NIS 240 million in the corresponding period.
(1) Based on non-GAAP data, which include the proportionate consolidation of jointly-held partnerships (without implementation of IFRS 11) and do not include share-based payment, valuation of the balance of commodity hedging transactions as at end-of-period and other income and expenses, unless stated otherwise.
(2) Based on non-GAAP data, which include the proportionate consolidation of jointly-held partnerships (without implementation of IFRS 11) and do not include share-based payment, valuation of the balance of commodity hedging transactions as at end-of-period and other income and expenses, unless stated otherwise.
(3) Investments include the acquisition of fixed assets and investment in intangibles and deferred expenses.
Note: Financial data were rounded off to NIS millions. Percentages changes were calculated on the basis of the exact figures in NIS thousands.
(4) Based on non-GAAP data, which include the proportionate consolidation of jointly-held partnerships (without implementation of IFRS 11) and do not include share-based payment, valuation of the balance of commodity hedging transactions as at end-of-period and other income and expenses, unless stated otherwise.
(5) Fun & Indulgence figures include Strauss 50% share in the salty snacks business. International Coffee figures include Strauss 50% share in Três Corações (3C) – a company jointly held by the Group (50%) and by a local São Miguel Group (50%). International D&S figures reflect Strauss 50% share in Sabra and Obela. Other includes Strauss share in Strauss Water China.
Note: Financial data were rounded off to NIS millions. Percentages changes were calculated on the basis of the exact figures in NIS thousands.
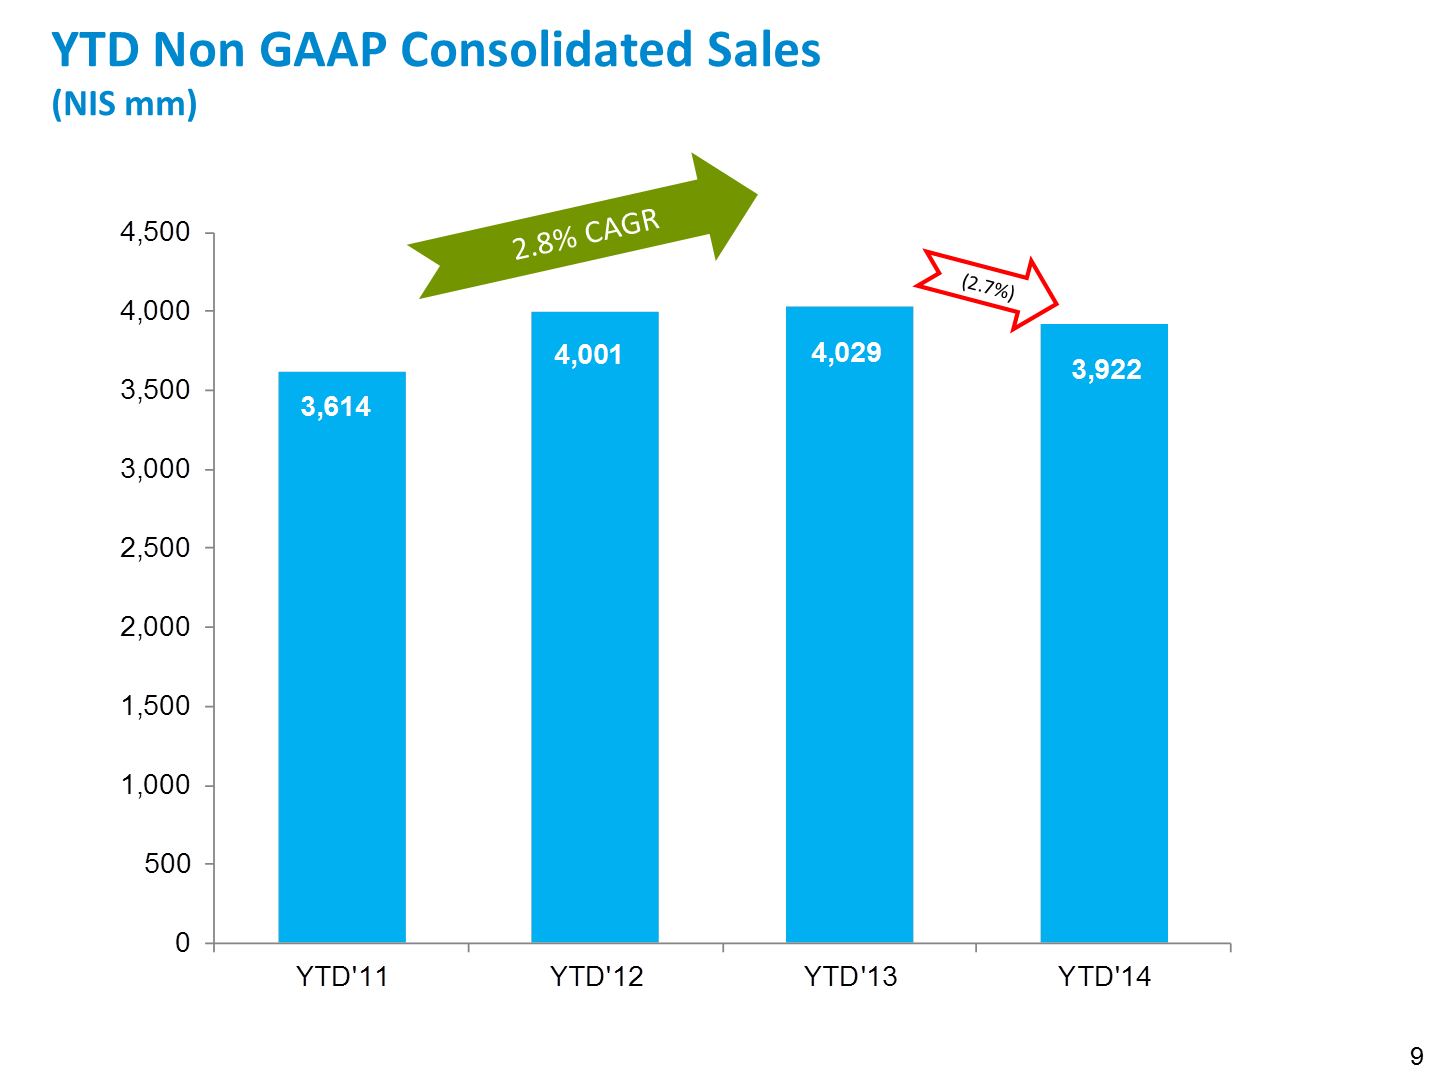
Appendix
The following multi-year graphs present sales, gross profit, operating profit and net profit for the first half and second quarter, 2011-2014.
For further information please contact:
Talia Sessler
Investor Relations Director Strauss Group Ltd.
972-54-577-2195
972-3-675-2545
talia.sessler@strauss-group.com
Osnat Golan
VP Communications & Digital, Spokesperson
Strauss Group Ltd.
972-52-828-8111
972-3-675-2281
Or
Gil Messing
External Communications Director
Strauss Group Ltd.
972-54-252-5272
