Strauss Group concludes 2014 with 4.2% organic sales growth excluding foreign currency impacts and 12.6% growth in net profit, thanks in part to income from the revaluation of currency hedging transactions([1])
Gadi Lesin, President and Chief Executive Officer of Strauss Group, said today (March 23, 2015): “Strauss Group has posted good annual results despite complex local and global challenges. Along with record results in two of the Group’s key international growth drivers – the coffee company in Brazil (Três Corações Joint Venture)([2])([3]) and the dips and spreads company in the U.S. and Canada (Sabra) – we coped with a political and economic crisis in Russia and Ukraine and a food marketsuffering a considerable slowdown in our home market, Israel. Strauss continues to implement a strategy aimed at deepening operations abroad while simultaneously tailoring the company to accommodate the changes and challenges in the Israeli food market. In addition, today we reported that the coffee company had filed a confidential draft prospectus with the SEC.”
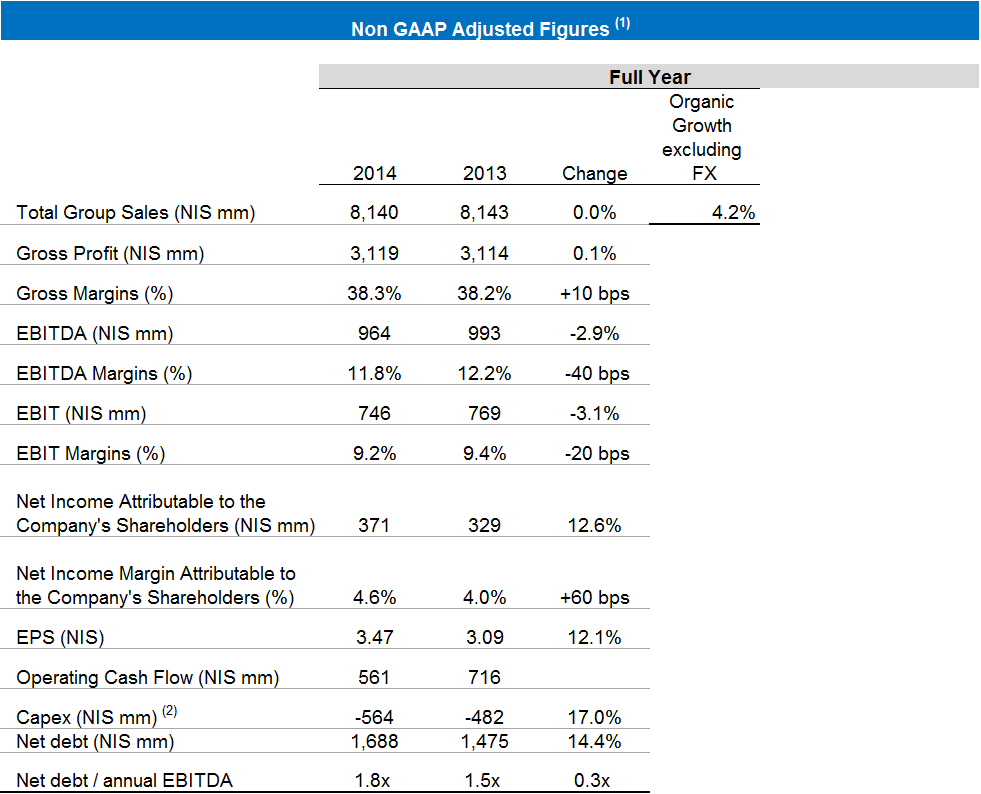
2014 highlights (1)
- Organic sales growth, excluding the foreign exchange effect, was 4.2%. Shekel sales were NIS 8.1 billion, similar to last year, and reflected NIS 333 million negative translation differences as a result of the continued strengthening of the NIS versus other functional currencies of the Group.
- Gross profit was NIS 3,119 million (38.3% of sales), up 0.1% compared to last year. Gross margins were up 0.1%.
- Operating profit (EBIT) was NIS 746 million (9.2% of sales), down 3.1% compared to last year. EBIT margins were down 0.2%.
- EPS for shareholders of the company was NIS 3.47 per share, up 12.1% compared to last year. The growth in EPS was mainly due to a decrease in the company’s net financing expenses, primarily reflecting income from hedges on the dollar against the ruble and on the dollar versus the shekel, thus partially offsetting the impact of the devaluation of the ruble on the cost of sales. The increase in profit also reflects a decrease in tax expenses.
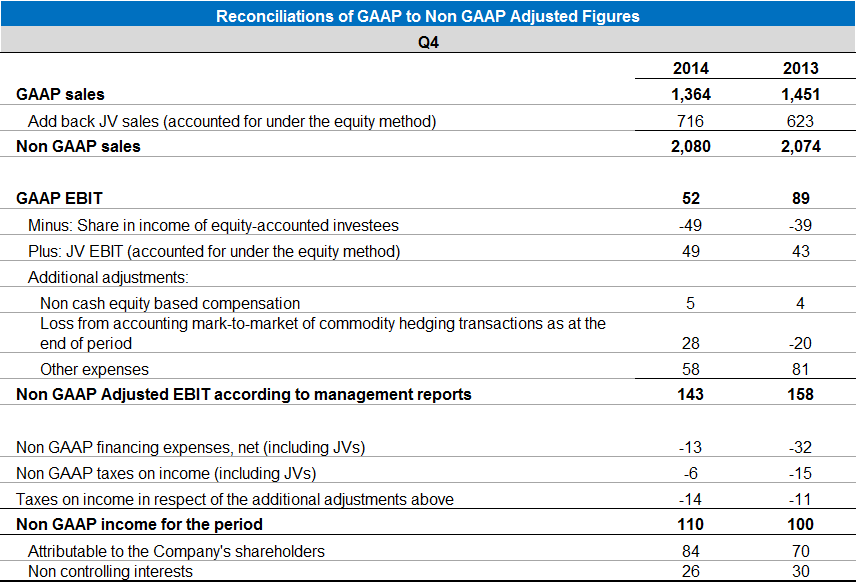
(1) Based on non-GAAP data, which include the proportionate consolidation of jointly-held partnerships (without implementation of IFRS 11) and do not include share-based payment, valuation of the balance of commodity hedging transactions as at end-of-period and other income and expenses, unless stated otherwise.
(2) Três Corações Joint Venture (3C) – Brazil (a company jointly held by the Group (50%) and by the São Miguel Group (50%)).
(3) Record results in the coffee company in Brazil refer to results of operations in domestic currency (BRL).
Cash flows from operating activities were NIS 561 million, compared to NIS 716 million in 2013.
(1) Based on non-GAAP data, which include the proportionate consolidation of jointly-held partnerships (without implementation of IFRS 11) and do not include share-based payment, valuation of the balance of commodity hedging transactions as at end-of-period and other income and expenses, unless stated otherwise.
(2) Investments include the acquisition of fixed assets and investment in intangibles and deferred expenses.
Note: Financial data were rounded off to NIS millions. Percentages changes were calculated on the basis of the exact figures in NIS thousands.
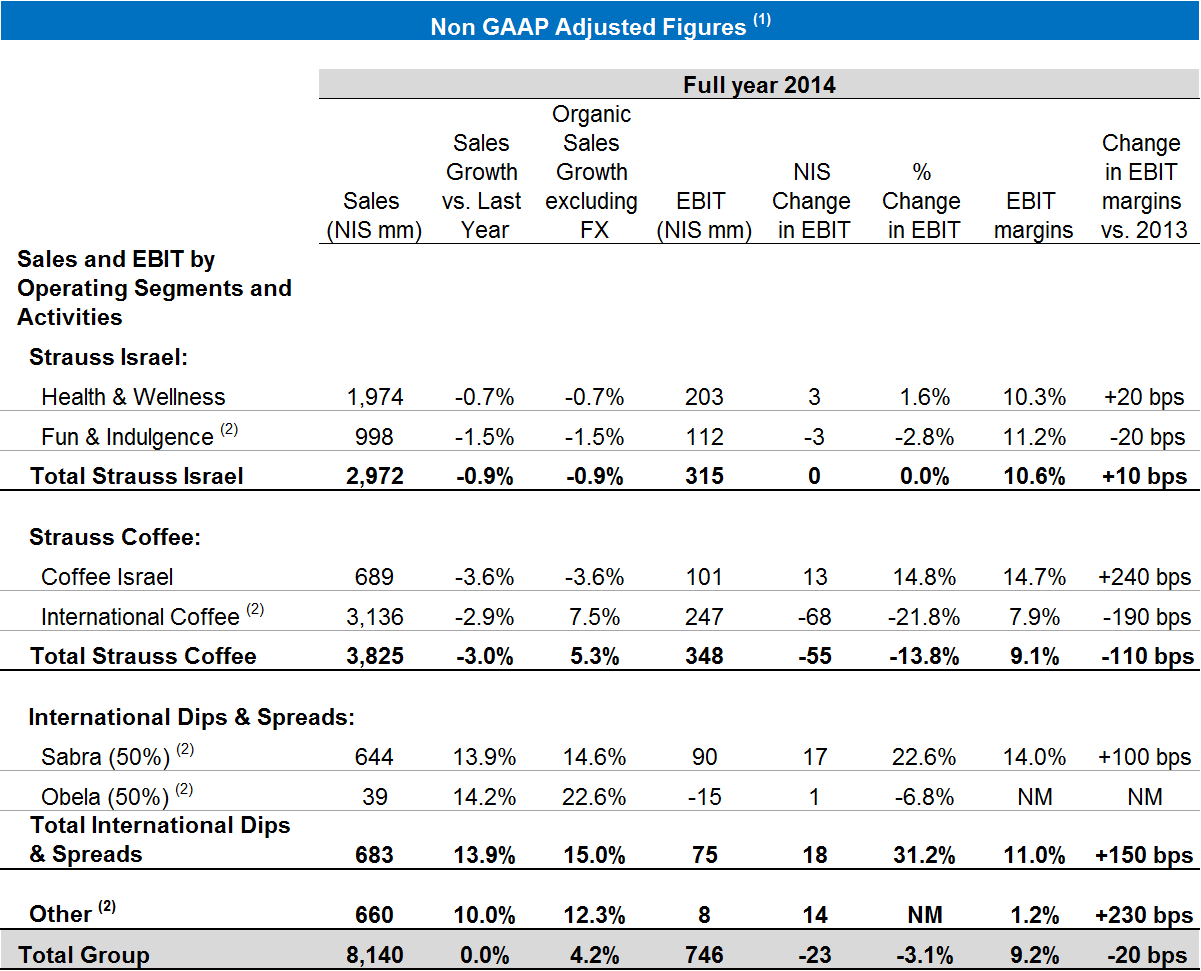
(1) Based on non-GAAP data, which include the proportionate consolidation of jointly-held partnerships (without implementation of IFRS 11) and do not include share-based payment, valuation of the balance of commodity hedging transactions as at end-of-period and other income and expenses, unless stated otherwise.
(2) Fun & Indulgence figures include Strauss 50% share in the salty snacks business. International Coffee figures include Strauss 50% share in Três Corações Joint Venture (3C) – Brazil – a company jointly held by the Group (50%) and by the São Miguel Group (50%). International D&S figures reflect Strauss 50% share in Sabra and Obela. Other includes Strauss share in Strauss Water China.
Note: Financial data were rounded off to NIS millions. Percentages changes were calculated on the basis of the exact figures in NIS thousands.
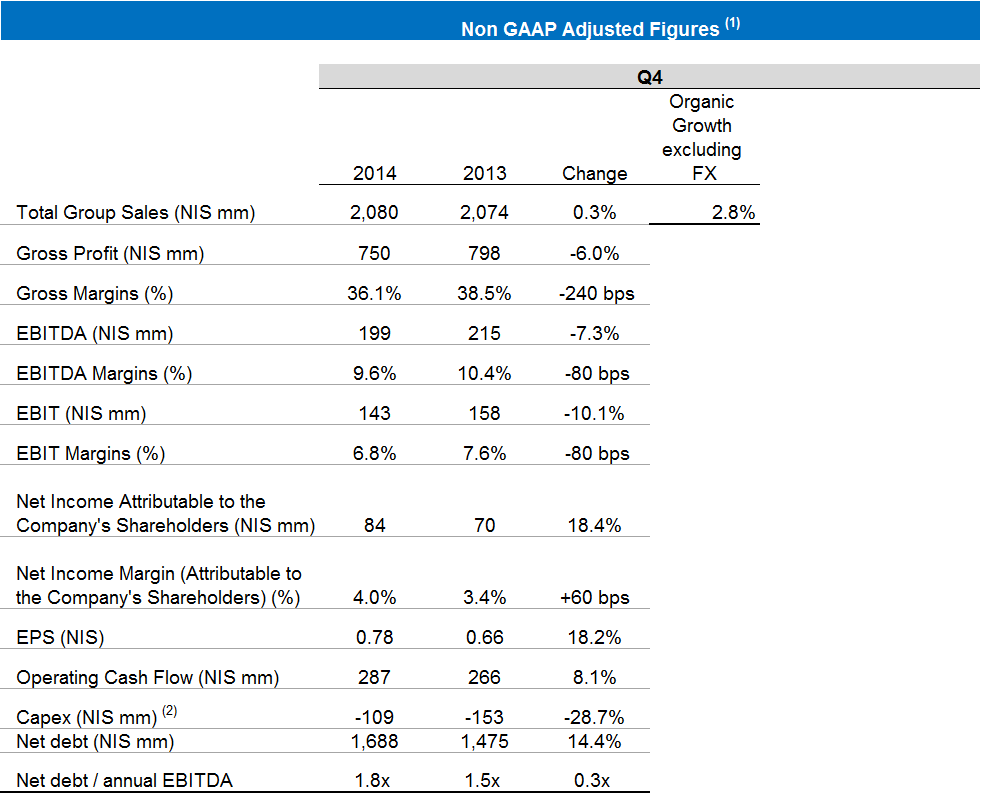
Q4 2014 highlights (1)
- Organic sales growth, excluding the foreign exchange effect, was 2.8%. Shekel sales were NIS 2.1 billion, up 0.3%, and reflected NIS 60 million negative translation differences as a result of the continued strengthening of the NIS versus other functional currencies of the Group.
- Gross profit was NIS 750 million (36.1% of sales), down 6.0% compared to the corresponding period last year. Gross margins were down 2.4%.
- Operating profit (EBIT) was NIS 143 million (6.8% of sales), down 10.1% compared to the corresponding period last year. EBIT margins were down 0.8%.
- EPS was NIS 0.78 per share, up 18.2% compared to the corresponding period. The growth in EPS was mainly due to a decrease in the company’s net financing expenses, primarily reflecting income from hedges on the dollar against the ruble and on the dollar versus the shekel, thus partially offsetting the impact of the devaluation of the ruble on the cost of sales. The increase in profit also reflects a decrease in tax expenses.
- Cash flows from operating activities were NIS 287 million, compared to NIS 266 million in the corresponding period in 2013.
- Net debt as at December 31, 2014 was NIS 1,688 million, compared to NIS 1,475 million on December 30, 2013.
(1) Based on non-GAAP data, which include the proportionate consolidation of jointly-held partnerships (without implementation of IFRS 11) and do not include share-based payment, valuation of the balance of commodity hedging transactions as at end-of-period and other income and expenses, unless stated otherwise.
(1) Based on non-GAAP data, which include the proportionate consolidation of jointly-held partnerships (without implementation of IFRS 11) and do not include share-based payment, valuation of the balance of commodity hedging transactions as at end-of-period and other income and expenses, unless stated otherwise.
(2) Investments include the acquisition of fixed assets and investment in intangibles and deferred expenses.
Note: Financial data were rounded off to NIS millions. Percentages changes were calculated on the basis of the exact figures in NIS thousands.
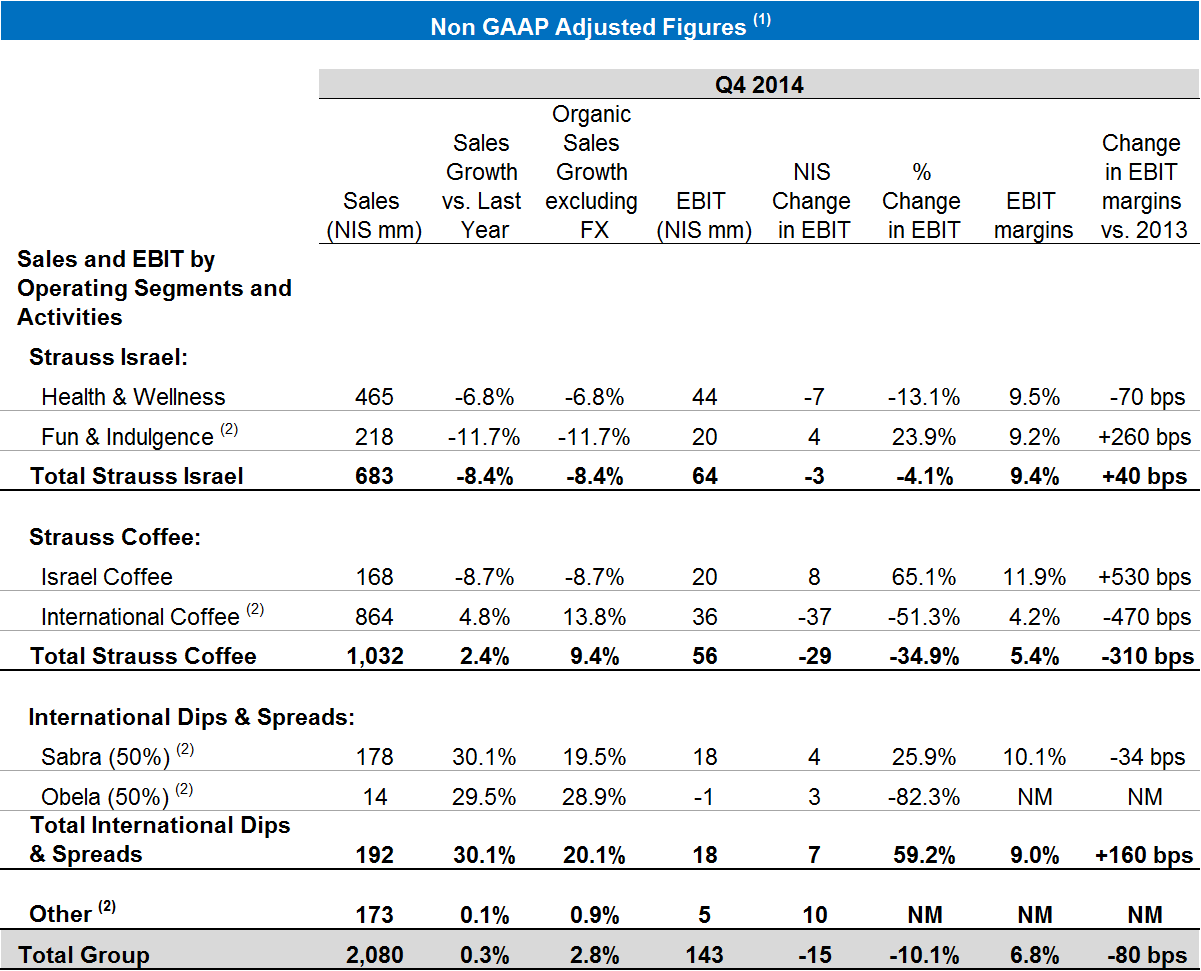
(1) Based on non-GAAP data, which include the proportionate consolidation of jointly-held partnerships (without implementation of IFRS 11) and do not include share-based payment, valuation of the balance of commodity hedging transactions as at end-of-period and other income and expenses, unless stated otherwise.
(2) Fun & Indulgence figures include Strauss 50% share in the salty snacks business. International Coffee figures include Strauss 50% share in Três Corações Joint Venture (3C) – Brazil – a company jointly held by the Group (50%) and by the São Miguel Group (50%). International D&S figures reflect Strauss 50% share in Sabra and Obela. Other includes Strauss share in Strauss Water China.
Note: Financial data were rounded off to NIS millions. Percentages changes were calculated on the basis of the exact figures in NIS thousands.

For further information please contact:
Talia Sessler
Investor Relations Director
Strauss Group Ltd.
972-54-577-2195
972-3-675-2545
talia.sessler@strauss-group.com
Osnat Golan
VP Communications & Digital, Spokesperson
Strauss Group Ltd.
972-52-828-8111
972-3-675-2281
Or
Gil Messing
Externat Communications Director
Strauss Group Ltd.
972-54-252-5272
