
Environmental Stewardship
- @StraussGroup knows that you want corporations, including us, to be environmentally responsible #sustainability
You are more aware than ever before of the environmental risks that we face as a global community. Whether you live in the U.S., and have been exposed to unprecedented weather extremes, ranging from drought to floods to tornadoes, or in Asia, where earthquakes and hurricanes may have brought disaster to your lives, or in Southern climates where tropical cyclones have caused endless damage, or in Israel where the threat of water scarcity is a daily reality, you cannot ignore the new accelerated phase of environmental risk that humanity finds itself in. You understand, today, that climate change is precipitated by human action and that deforestation, fossil fuel combustion, uncontrolled use of the planet’s finite resources and that the waste generated by our consumption-intensive lifestyles is no longer a feasible way forward. You know that if we carry on in this way, the quality of our lives will deteriorate severely, both in our lifetime and in that of our future generations. All stakeholders look to corporations to take responsibility and account for their impacts on the environment and this often affects the way you shop, the brands you buy and the food you eat.
We need to satisfy our stakeholders that we are doing everything we can to protect our planet and our quality of life. In recent years, we have adopted a new Environmental Management System which has been put in place across most manufacturing sites, we have appointed Environment Officers and Green Teams with diverse employees, invested in a range of programs to reduce energy, water and materials consumption, redesigned packaging for eco-benefits, increased our recycling, retrofit operations for greater efficiency and engaged in green construction to reduce the impacts of our facilities. We have created energy from biomass and developed solar-based solutions for a renewable power source. We are doing what we can but we need to do more. We must reassure you that we are taking all possible steps to be an environmentally responsible food manufacturer.
- Reduce, Reuse and Recycle is our approach to environmental stewardship @StraussGroup
As our business expands, both through organic growth and acquisitions, we use more of the earth’s resources. We attempt to absorb the effects of this growth, by, as far as possible, producing more while not using more resources, or even using fewer resources on an absolute basis. We follow a 3R approach (Reduce, Reuse and Recycle) as far as possible. At the same time, we monitor the impact of our operations per ton of product manufactured, which gives you a measure of the relative environmental performance of the products you buy from Strauss Group.
Environmental Investments
Over the past three years, in addition to all our running costs related to management and improvement of environmental systems, we have invested over U.S.$ 10 million in technology and equipment investments to improve our overall impacts on the environment through energy efficiency, wastewater treatment, lighting retrofits, recycling processes and more. Driven by responsibility, we think it’s important that you know we are not just walking the talk, we are paying for it. This means that you, our customers, can be reassured that we have your long-term well-being at heart.
| Environmental Investments | Total Investments in U.S. $ millions | |||||
|---|---|---|---|---|---|---|
| Year | 2010 | 2011 | 2012 | Change from 2011 (%) | Change from 2010 (%) | |
| Investments in envrionmental improvements | $ millions | 3.32 | 2.63 | 5.95 | 226 | 179 |
Our environmental investments relate primarily to projects to improve energy efficiency, wastewater treatment and waste segregation facilities.
Materials Consumption
The main raw materials we use in our manufacturing operations around the world to make the products that you enjoy eating and drinking include liquid unprocessed milk for our dairy products in Israel, liquid and powder cocoa derivatives for our confectionery and chilled dessert lines, chickpeas and tahini for our hummus and other products in Israel, the U.S., Mexico and Australia, fresh fruits and vegetables in Israel and the U.S, for our fresh and chilled salads and dips, as well as frozen and crushed fruits, and green coffee, cocoa powder, sugar, chicory, corn and other flavored ingredients for our coffee operations in Israel, Brazil and Central and Eastern Europe. We also use significant amounts of sugar, olive oil, honey flour, oil, nuts and potatoes.
- To satisfy our coffee-drinking consumers all over the world, we purchased 179,000 tons of green coffee in 2012 #greattaste @StraussGroup
In addition, we use packaging materials for our diverse product ranges to ensure our products get to you safely and unspoiled. This includes plastic bottles, tubs, jars, tube and wrappers, as well as laminated foils, paper, card and cardboard for outer cartons. We package coffee in glass jars, metal tins, laminated foils and plastic packs. We use large amounts of plastic wrapping and sealing tape for shipments. Driven by responsibility, we continue to reassess all our packaging design to reduce materials used and ensure optimum efficiency in transportation.
Reducing the weight of plastic bottles
- Yotvata Choco Drink – now in lightweight PET bottles with 25% less plastic. #packaging
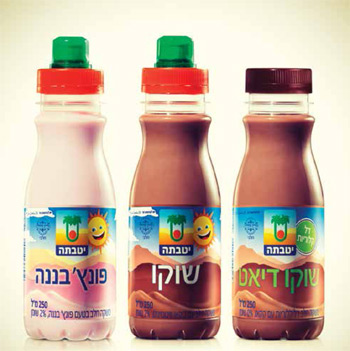 During 2012, after four years of engagement in an innovative development process with our plastic bottle supplier, our Yotvata dairy plant in the south of Israel achieved a reduction of 25% in its main packaging unit, 250ml bottles. We reduced the weight of plastic used to make the bottle from 16 to 12 grams without compromising bottle quality or jeopardizing the quality and safety of the product.
The plastic used in these bottles is PET (polyethylene terephthalate), which is made from crude oil derivatives. Globally, millions of tons of plastic are used to make plastic bottles for all types of beverages, and our relatively small consumption of some thousand tons for our 11 million annual units of Yotvata Choco drink produced is not very significant. However, we do whatever we can wherever we can, and more than 40 tons reduction in PET quantities per year is a good saving. Our lightweight PET bottles require fewer raw materials to produce, less fuel for transport and are completely recyclable.
- Hummus salads and dips packaging is made from 30-45% post-consumer recycled plastic #packaging @Sabra
Energy Performance
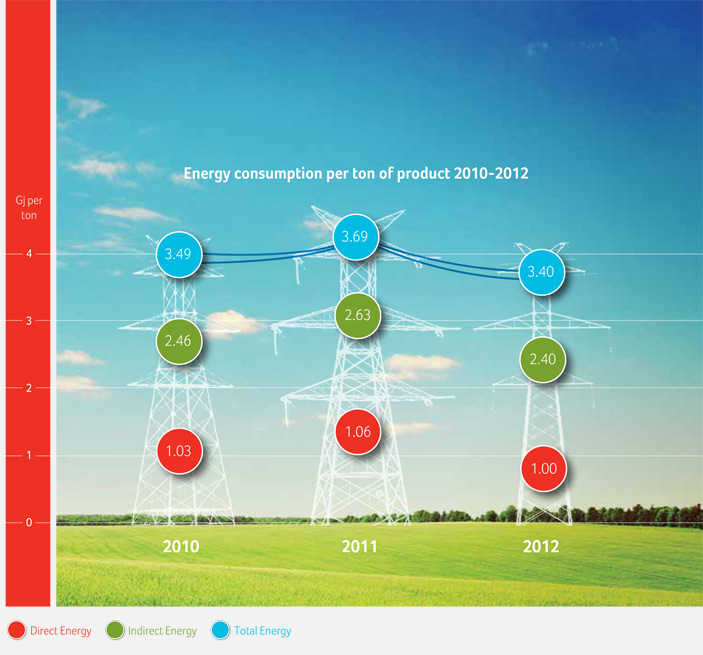
- @StraussGroup is committed to achieving a lower energy footprint in our global operations #sustainability #energyreduction
Energy powers our production facilities, our warehousing and logistics systems, our offices and our activities in the marketplace. We use a range of energy sources, including direct energy from different gases and fuels, and indirect energy from purchased, non-renewable electricity, sourced from the National Electricity Grids in the countries of operation. We are determined to meet your expectations and reduce our consumption so that the products you buy will have a lower energy footprint and the planet you live on will be preserved for future generations.
- @StraussGroup reduced energy consumption per ton of product by 16% over 2 years (2010-2012) #energyefficiency
| Energy Consumption | Absolute consumption | |||||
|---|---|---|---|---|---|---|
| 2010 | 2011 | 2012 | Change from 2011 (%) | Change from 2010 (%) | ||
| Direct Energy | Units | |||||
| Liquid Petroleum Gas | Gj | 287,930 | 289,898 | 281,495 | -3 | -2 |
| Natural Gas | Gj | 413,503 | 403,040 | 421,510 | 5 | 2 |
| Oil and Fuel | Gj | 135,762 | 140,796 | 161,684 | 15 | 19 |
| Diesel Fue | Gj | 94,373 | 96,901 | 95,707 | -1 | 1 |
| Petroleum (Gasoline | Gj | 137,325 | 117,527 | 139,298 | 19 | 1 |
| Ethanol | Gj | 725 | 1,175 | 1,255 | 7 | 73 |
| Biomass from coffee grounds | Gj | 86,520 | 91,317 | 29,734 | -67 | -66 |
| Total Direct Energy | 1,156,138 | 1,140,654 | 1,130,683 | -1 | -2 | |
| Indirect Energy | ||||||
| Purchased Electricity Consumption | Gj | 482,608 | 460,340 | 473,932 | 2.95 | -1.80 |
| Total Energy (Scope 1 and Scope 2) | Gj | 1,638,746 | 1,600,994 | 1,604,615 | 0.23 | -2.08 |
Note: See Notes to Data Collection section in this report for details of data collection scope and methods.
- @StraussGroup reduced absolute energy consumption levels over two years (2010-2012) while increasing production by 16% #energyefficiency
Our energy management performance in recent years reflect the results of ongoing efforts in all our plants around the world to reduce energy consumption throughout the production process, ranging from the introduction of renewable biomass in our plants in Israel and Serbia, solar arrays in Poland, our LEED certified energy-efficient Sabra plant in Virginia U.S., rechanneling heat from compressors into production halls to save heating costs, controlled management of air conditioning units, auto-electricity shut-offs and use of motion-sensors for lighting savings and a range of retrofit energy-efficient lighting projects in many facilities.
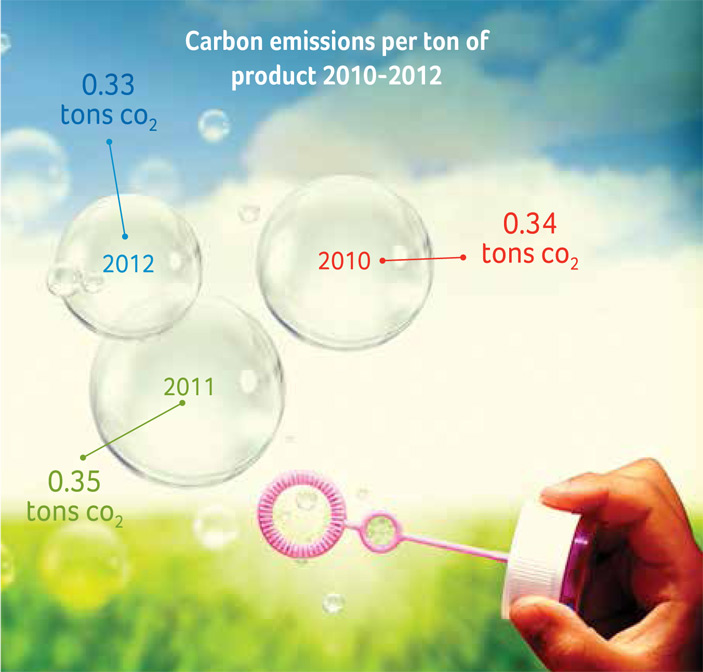
Greenhouse gas emissions performance
Greenhouse gas emissions (the main one is carbon dioxide) are a major cause of the climate change extremes our planet is experiencing. It’s not that carbon emissions are a bad thing, in isolation. The problem is that an increasingly high concentration of greenhouse gas emissions traps heat in the earth’s atmosphere and stifles the working of our natural ecosystems. Overall, our global temperature has been rising faster in the past ten years than at any other time in history, due to industrialization, globalization, consumerism and frankly, uncontrolled pursuit of growth by corporations. This doesn’t just make our planet hotter. It contributes to many phenomena and threats to human health, including biodiversity loss, rising sea levels, fresh water scarcity, desertification, natural weather extremes, population displacement and more. Many governments now are regulating climate change by putting caps, or even taxes, on carbon emissions from corporate activity. Climate change affects our business in the way it impacts agricultural productivity, the stability of communities in the areas in which we operate and the overall economic global climate.
- Between 2010 and 2012, @StraussGroup reduced greenhouse gases emitted to the atmosphere per ton of manufactured product by 13.92% #climatechange
| Greenhouse Gas Emissions | Absolute emissions | |||||
|---|---|---|---|---|---|---|
| Year | 2010 | 2011 | 2012 | Change from 2011 (%) | Change from 2010 (%) | |
| Direct Energy | Units | |||||
| Liquid Petroleum Gas | Tons Co2e | 18,653 | 18,821 | 18,279 | -3 | -2 |
| Natural Gas | Tons Co2e | 23,197 | 22,278 | 23,299 | 5 | 0 |
| Fuel Oil | Tons Co2e | 10,573 | 10,990 | 12,620 | 15 | 19 |
| Diesel Fuel | Tons Co2e | 6,990 | 7,276 | 7,234 | -1 | 3 |
| Petroleum (Gasoline) | Tons Co2e | 9,482 | 8,282 | 9,816 | 19 | 4 |
| Ethanol | Tons Co2e | 51 | 83 | 89 | 7 | 75 |
| Biomass from coffee grounds | Tons Co2e | 0 | 0 | 0 | 0 | 0 |
| Total Direct Energy Emissions | Tons Co2e | 68,946 | 67,730 | 71,337 | 5 | 3 |
| Indirect Energy Emissions | Tons Co2e | |||||
| Purchased Electricity Consumption | Tons Co2e | 85,958 | 82,843 | 83,410 | 0.68 | -3 |
| Total Emissions | Tons Co2e | 154,904 | 150,573 | 154,747 | 2.77 | -0.10 |
Note: See Notes to Data Collection section in this report for details of data collection scope and methods.
In many ways, carbon and other greenhouse gas emissions are a direct result of the amount of energy we use, so our first priority is to reduce energy consumption, as we have been doing. However, we also influence the level of emissions through the sources of energy we consume. For example, using our renewable biomass, made from coffee bean processing waste, emits zero carbon emissions. Using natural gas instead of electricity from the National Grid reduces carbon emissions by more than half, per unit of consumption. Therefore, we take what is known as a precautionary approach and constantly review our energy mix and seek to innovate to generate a more favorable carbon emission impact, so that you and your grandchildren can continue to enjoy our rich global biodiversity.
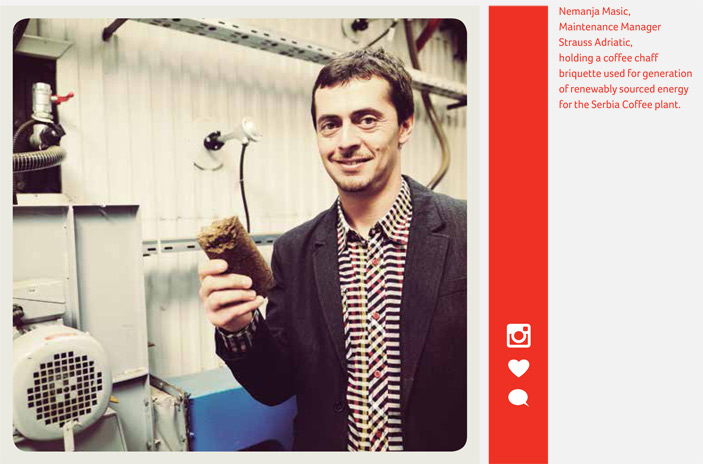
Our award-winning biomass energy process in Serbia
We briefly reported in 2011 that we had installed a new facility to create biomass from coffee chaff. Coffee chaff is the name we use for the husks of coffee beans which are sucked out of the coffee-bean separation process during manufacturing. In the new biomass process, a first for the coffee industry anywhere as far as we know, these husks, instead of being routed to landfill as waste, are crushed together to form briquettes, and burned as fuel to generate hot water for heating our factory in Serbia.
In 2012, we reaped triple rewards as a result of this innovation. First, we gained one full year of operation of the biomass production which reduced our factory heating costs. Second, we reduced our carbon emissions as by not purchasing Natural Gas used for winter heating requirements at the factory. Third, we were honored to receive an award for this innovative process, the “Aurea Best Innovation Award” granted by the prominent Serbian business portal “eKapija“. In 2013, we will host a meeting of the technical manufacturing experts in the global Strauss coffee teams to present this new technology and review reapplication in Strauss coffee plants around the world. How does this affect you, our stakeholders? It avoids more tons of waste filling up landfill sites across your country, and it reduces carbon emitted into the atmosphere, which helps us combat the effects of climate change. We benefit, you benefit.
The story starts with a forward-thinking Maintenance Manager, Nemanja Mašić, at our Serbian Simanovci coffee factory. Nemanja repurposed an idea that had been implemented in Israel to create energy from coffee waste, by focusing on coffee chaff generated during the process, not waste produced at the end of the process, as a source of energy. Nemanja consulted with the Mechanical Engineering Faculty at the University of Serbia, an analysis institute in Austria and other independent experts to help evaluate the feasibility and potential of this idea. Following scientific corroboration, Nemanja and the Serbia team led the coffee chaff biomass development process, which included acquiring a special boiler to handle the coffee chaff separation. After installation at end 2011, in 2012, we produced 140 tons of coffee chaff briquettes, which provided enough energy to heat the factory for three months, representing winter heating requirements at Simanovci and reducing energy costs by over Euro 83,000 per year. In 2012, the factory avoided over 300 tons of total carbon emissions through reducing Natural Gas consumption (as well as other energy initiatives in the factory). That’s equivalent to taking more than 60 cars off Serbia’s roads every year. This is a first for Serbia, but, we hope, not a last!
Carbon emissions from all energy sources in Serbia 2010-2012 (tons CO2) per ton of product
| 2010 | 2011 | 2012 | |
|---|---|---|---|
| 0.385 | 0.377 | 0.340 |
- Reducing 300 tons of carbon emissions @StraussGroup through biomass energy equaled more than 60 cars off the road in Serbia in 2012
Another area in which we influence climate change is through the operations that create greenhouse gas through work performed by third parties (for example, distributors of our products) and through the business travel we undertake. These are called Scope Three emissions by the Greenhouse Gas Protocol, the global authority on greenhouse gas emission accounting. So far, we have not been able to measure our entire Scope Three emissions, but we are working on doing this more completely in the future.
- For the first time in 2012, @StraussGroup measured Scope Three emissions from air travel. We flew around the world 21 times.
![]() As a start, for the first time, we have tracked our business air travel in 2012. Around the globe, we took 1,221 flights, or around 100 flights per month, covering over 850,000 air kilometers. This caused 1,149 tons of greenhouse gas emissions, which is equivalent in greenhouse gas terms to planting almost 27,000 trees. This is now our baseline for future performance. Where we can reduce air travel in favor of virtual meetings, we will do so. We have equipped all our major office centers with videoconferencing facilities and expect to increase their use in the future.
As a start, for the first time, we have tracked our business air travel in 2012. Around the globe, we took 1,221 flights, or around 100 flights per month, covering over 850,000 air kilometers. This caused 1,149 tons of greenhouse gas emissions, which is equivalent in greenhouse gas terms to planting almost 27,000 trees. This is now our baseline for future performance. Where we can reduce air travel in favor of virtual meetings, we will do so. We have equipped all our major office centers with videoconferencing facilities and expect to increase their use in the future.
Ozone-depleting substances
Certain substances, defined by international protocols, cause the ozone layer to erode (the ozone layer absorbs ultra-violet light from the sun, so if there is a big hole in it, we suffer the harmful effects of UV radiation on earth). In line with these protocols, we report the levels of such ozone-depleting substances in the different categories as defined by the technical experts. The substances involved, as far as our operations at Strauss are concerned, are mainly different types of coolants used in our refrigeration and some air-conditioning systems. The type and level of such coolants emissions depends on both the technologies we use, the state of our equipment and our careful handling and operational practices. At a level of just over 7,000 kg emissions of ozone-depleting substances in our global operations, which is barely 15 grams emissions per ton of product manufactured, our impact is modest. For reference, this is equivalent to around 8 regular home-style refrigerators.
Air
Emissions
from Ozone
Depleting
SubstancesAir Emissions from Ozone Depleting
Substances in KGYear 2010 2011 2012 Change from
2011 (%)Change from
2010 (%)ODS in 2012
include: R-22,
407C,R-410A6,068 15,791 7,023 56 16
- @StraussGroup emitted 7 tons of ozone-depleting substances in different coolants in 2012, less than half of 2011 ODS emissions #ODS #ozone
Specific air pollutants
The use of fuels to operate Strauss facilities (ovens, boilers and others) in production processes causes the emissions of various pollutants into the air and cause environmental degradation. These substances have been determined by international protocols and are well known and well-defined. Our objective is, of course, to minimize the emissions of such substances, though in 2012, we saw an increase due to the increase in our total 2012 production.
| Emissions from Air Pollutants | Emissions in tons | |||||
|---|---|---|---|---|---|---|
| Year | 2010 | 2011 | 2012 | Change from 2011 (%) | Change from 2010 (%) | |
| SOx (sulphur oxides) | Tons | 138 | 132 | 166 | 26 | 20 |
| NOx (nitrogen oxides) | Tons | 93 | 92 | 139 | 51 | 49 |
| PM (particulate matter) | Tons | 28 | 27 | 22 | -13 | -21 |
| Total Emissions from Air Pollutants | Tons | 259 | 251 | 327 | 30 | 26 |
Water performance
 Water is used in limited ways in different processes in our production operations, and also for cleaning, drinking and food preparation in our cafeterias, for hygiene purposes and, in some facilities, gardening. We draw almost all our water from the National Grid networks in the locations in which we operate – a small number of facilities draw water from water wells located on site. Our water impact is relatively modest compared to other manufacturing sectors. However, that’s not to say you don’t expect us to improve our performance here too, and that’s what we aim to do.
- In 2012, @StraussGroup reduced water consumption per ton of product by 1.31% versus 2011. #water
| Water Consumption | Absolute performance | Performance per ton product manufactured | ||||||||||
|---|---|---|---|---|---|---|---|---|---|---|---|---|
| 2010 | 2011 | 2012 | Change from 2011 (%) | Change from 2010 (%) | 2010 | 2011 | 2012 | Change from 2011 (%) | Change from 2010 (%) | |||
| Water consumption | m3 | 1,206,436 | 1,438,678 | 1,506,410 | 4.71 | 24.86 | 3.3.048 | 3.319 | 3.276 | 1.31 | 7.47 | |
In 2012, we managed to curb our increasing water consumption per ton of manufactured product and achieve a reduction of 1.31%. The impact of acquired companies and operational expansion (over 16% growth in production volumes between 2010 and 2012) as well as an increase of 6% in the number of people employed in our facilities during this period, meant that, inevitably, more people need water to drink, shower after production shifts and use the bathrooms, so more water is required. Measures we are taking to reduce water consumption include low-flow taps in all installations, low-flush toilets, increase communications for greater employee awareness and, in our production operations, use of recycled water from A/C units where possible and introduction of new processes which save water, such as water purification to enable increased water recycling.
Waste performance
- In 2012, @StraussGroup recycled or reused over 77% of our total solid waste #waste
We generate waste in our production processes and in our packaging operations, and in our offices. We consider the downstream effects of packaging design in all our product decisions and attempt to create products which we know will require less packaging, and therefore generate less waste, both in our production process, and when you have finished consuming the products in your homes. As far as possible, we look to put every scrap of waste back into our process, or recycle it in an efficient way.
| Solid Waste | Absolute waste in tons | |||||
|---|---|---|---|---|---|---|
| Year | 2010 | 2011 | 2012 | Change from 2011 (%) | Change from 2010 (%) | |
| Waste to Landfill | Tons | 14,857 | 14,824 | 15,367 | 4 | 3 |
| Waste to Landfill | Tons | 42,016 | 41,932 | 47,728 | 14 | 14 |
| Waste to Landfill | Tons | 4,781 | 14,095 | 9,629 | -32 | 101 |
| Waste to Landfill | Tons | 3.76 | 1.03 | 3.74 | 263 | 0 |
| Waste to Landfill | Tons | 61,658 | 70,852 | 72,728 | 3 | 18 |
Overall, this amounts to around 0.16 tons of waste per ton of product, of which, in 2012, the vast majority, (79%) was reused or recycled. The most significant proportion of all of our waste is biomass we reuse in our facilities, or send for reuse by other manufacturers. In some cases, such as our biomass operations, we used production waste (coffee chaff and coffee bean residues) and transform it in to an energy source. We donate all electronic waste for safe dismantling and recycling.
The small amounts of hazardous waste we generate are residual maintenance and cleaning materials or chemicals used in our quality control and development laboratories. All such waste is strictly monitored, labeled and collected for landfill via authorized handlers. No hazardous waste is shipped abroad.
- In 2012, @StraussGroup we recycled 79% of our solid waste #recycling
Wastewater performance
Water discharge from our plants carries different pollutants, which, in most cases, we treat at our factories prior to sending wastewater to local certified purification facilities. We have invested big sums over the years to improve our wastewater treatment capabilities and the facility at our Ahihud Dairy in the north of Israel and in Sabra plant in Virginia U.S., for example, in order to deliver lower levels of organic pollutant material than is required by law.
In 2012, our total water discharge was 1,183,858 m3 for our global operations. This is the first time we have reported total water discharge figure for the Group.
- In 2012, water discharged from our @StraussGroup operations amounted to 79 % of our total water consumption. #wastewater
We continue to focus on discharging wastewater from our operations at the highest level of purity, and we use the main wastewater pollutant analyses, in line with leading practice around the world, to understand the impact of our water discharge. These test measure solids remaining after water filtration, as well as the level of chemicals which can cause biological reactions. This helps us understand the biodegradability levels of our wastewater discharge, which ultimately reaches our rivers, lakes and seas. We aim to achieve the highest levels of purification in order to reduce risks from such wastewater pollutants.
| Wastewater pollutants | Total wastewater pollutant levels | |||||
|---|---|---|---|---|---|---|
| Year | 2010 | 2011 | 2012 | Change from 2011 (%) | Change from 2010 (%) | |
| TSS (Total Suspended Solids) | Tons | 721 | 1,921 | 921 | -52 | 28 |
| COD (Chemical Oxygen Demand) | Tons | 2,656 | 1,368 | 2,414 | 76 | -9 |
| BOD (Biological Oxygen Demand) | Tons | 1,489 | 1,370 | 1,128 | -18 | -24 |
| Total wastewater pollutants | Tons | 4,866 | 4,658 | 4,463 | -4 | -8 |
Between 2010 and 2012, we have achieved a reduction of 4.27% in our modest wastewater pollutant levels, which is more than 17% per ton of product manufactured.
A novel solution for salty snacks wastewater purification
In our salty snacks factory in Israel, we have implemented a novel solution to resolve non-degradable solids and high pH levels in the wastewater generated by our tortilla chips products. Up until 2012, the tortilla chips waste stream was polluted to levels higher than those acceptable by local municipal sewage systems, and meant that this wastewater had to be shipped from the plant to special purification facilities. There was no easy solution, and our scientists and production experts tried many solutions without success.
In early 2012, recognizing that we have a mass of untapped talent and expertise through our Alpha Strauss food-tech innovation program (see section on Product Innovation), we approached the Alpha Strauss network for assistance. Within the space of a few short weeks, an innovative solution was found, which uses electrical pulses to remove pollutant particles. Routing wastewater from tortilla chips production through this system, we are able to deliver clean water of a standard comparable to drinking water, and discharge it to municipal waste systems with no risk to people, animals or flora and fauna.
A novel solution for coffee wastewater purification
In 2012, we turned our focus to wastewater treatment in our coffee production facility in Safed in Israel. Our objective was to deliver a preventive system, which would purify the excess water from our coffee operations while still in the production process, ahead of generating wastewater which is treated post-production. The solution we implemented, at an investment of U.S.$ 1.2 million, is a complex filtration system, developed by our scientists at Strauss Coffee, which uses a uniquely-structured membrane in a reverse osmosis process that separates coffee particles from excess water, resulting in clean water approaching drinking standard quality. This is a particularly innovative solution because this membrane was not developed for use in the food industry – its main use is treating water in chemical plants. In fact, we are the only company in the world, as far as we know, that uses this type of process in coffee production.
Another benefit of our membrane solution is that more than one ton of coffee, or about 1.5% of our total coffee production at the Safed plant, is retrieved in the filtration process and recycled back to production. This means more efficient, responsibly-produced coffee for your daily morning break. In addition, we recycle about 2 cubic meters of water per hour after it exits the filtration system, thereby reducing our requirement for water from our National Water Grid, leaving more available for you to use in cooking, cleaning and maintaining the quality of your life.
In the future
2012 has been a year of consolidation and improvement as, in addition to making progress, we are reviewing our strategy at a global level. In our next report, we will share a new global strategy and new targets for environmental improvements.
- More progress can be expected from @StraussGroup in the area of environmental stewardship in the future. New targets in 2013.
